本文參考: Placing clusters on the same rank in Graphviz
You may use the newrank graph attribute (added in GraphViz 2.30) to activate the new ranking algorithm which allows defining rank=same for nodes which belong to clusters
您可以使用 newrank 圖形屬性(在 GraphViz 2.30 中添加)來激活新的rank 演算法,該演算法允許為屬於群集的節點定義 rank=same。
code:
# -*- coding: utf-8 -*-
"""
Created on Tue Nov 11 20:47:50 2024

@author: SavingKing
"""

from graphviz import Digraph

# 创建一个新的有向图,并设置newrank为true
dot = Digraph('G', graph_attr={'newrank': 'true'})
#dot.attr(newrank='true')  # 启用newrank

# 添加第一个群集(子图)
with dot.subgraph(name='cluster1') as c:
    c.attr(label='Local Datacenter')
    c.node('router1', 'Router 1')
    c.node('host1', 'Host 1')

# 添加第二个群集(子图)
with dot.subgraph(name='cluster2') as c:
    c.attr(label='Remote Datacenter')
    c.node('router2', 'Router 2')
    c.node('host2', 'Host 2')

# 添加边连接各节点
dot.edge('router1', 'router2')
dot.edge('router2', 'host2')
dot.edge('router1', 'host1')

# 添加rank同等约束
with dot.subgraph() as s:
    s.attr(rank='same')
    s.node('router1')
    s.node('router2')

# 渲染图形,保存并显示
dot.render('output/digraph', view=True)

# 打印出生成的 DOT 语言代码,用于调试
print(dot.source)
輸出的圖檔:
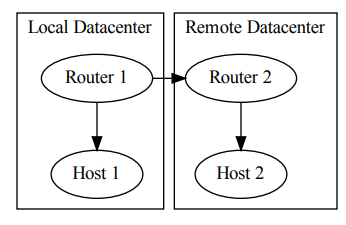
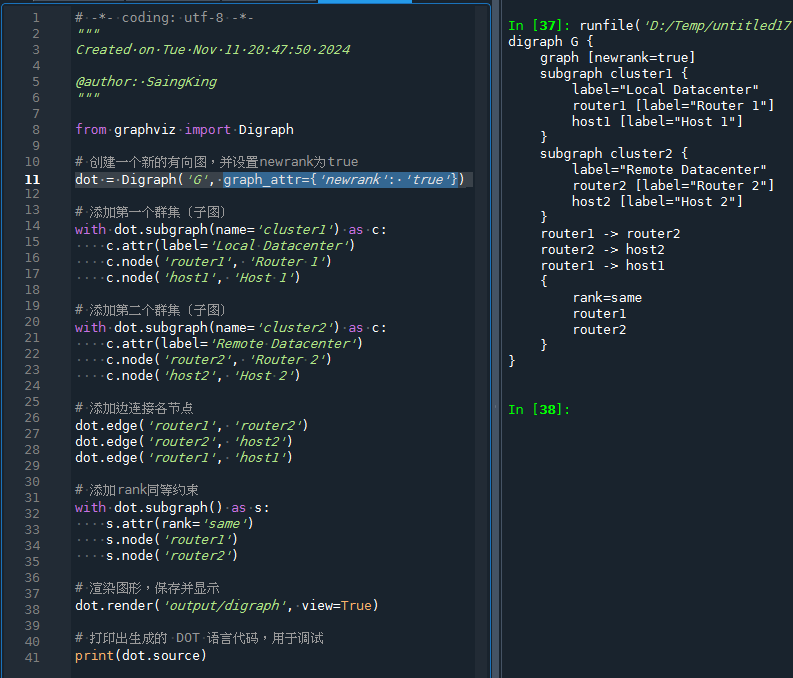
dot.source:
推薦hahow線上學習python: https://igrape.net/30afN
Python: 如何使用graphviz套件繪製流程圖? 如何創建子圖?
並沒有使用到
, graph_attr={'newrank': 'true'}

# 添加rank同等约束
with dot.subgraph() as s:
    s.attr(rank='same')
    s.node('router1')
    s.node('router2')
左右兩邊的子圖卻等高
原因是:
g.node('start', shape='Mdiamond') #,style='invis'
g.edge('start', 'a0') #,style='invis'
g.edge('start', 'b0') #,style='invis'

g.edge('b2', 'a3') #,style='invis'
#少b2 -> a3 就會導致b2 a3等高,
#兩個子圖的top來看(a0 vs b0),就左高右低
code:
# -*- coding: utf-8 -*-
"""
Created on Mon Nov 10 20:12:23 2024

@author: SavingKing
"""

from graphviz import Digraph

g = Digraph('G', filename='cluster.gv', format='png')

# 注意:子圖的名稱必須以 'cluster'(全部小寫)開頭
#       這樣 Graphviz 才能將其識別為特殊的集群子圖
with g.subgraph(name='cluster_0') as c:
    c.attr(style='filled', color='lightgrey')
    c.node_attr.update(style='filled', color='white')
    c.edges([('a0', 'a1'), ('a1', 'a2'), ('a2', 'a3')])
    c.attr(label='process #1')

with g.subgraph(name='cluster_1') as c:
    c.attr(color='blue')
    c.node_attr['style'] = 'filled'
    c.edges([('b0', 'b1'), ('b1', 'b2'), ('b2', 'b3')])
    c.attr(label='process #2')

g.edge('a0', 'b0')
g.node('start', shape='Mdiamond') #,style='invis'
g.edge('start', 'a0') #,style='invis'
g.edge('start', 'b0') #,style='invis'
#g.edge('a1', 'b3')
g.edge('b2', 'a3') #,style='invis'
# g.edge('a3', 'a0')
# g.edge('a3', 'end')
# g.edge('b3', 'end')

# g.node('end', shape='Msquare')

g.view()
輸出view:
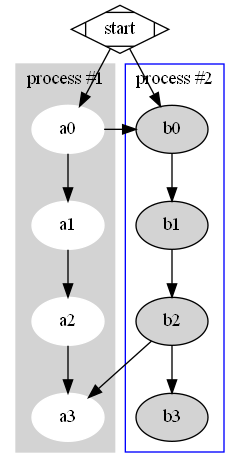
雖然多了以下:
g.node('start', shape='Mdiamond') #,style='invis'
g.edge('start', 'a0') #,style='invis'
g.edge('start', 'b0') #,style='invis'

g.edge('b2', 'a3') #,style='invis'
#少b2 -> a3 就會導致b2 a3等高,
#兩個子圖的top來看(a0 vs b0),就左高右低
但可以使用 style=’invis’ 將其隱藏
也可以達到左右兩邊子圖等高的效果
推薦hahow線上學習python: https://igrape.net/30afN
code:
# -*- coding: utf-8 -*-
"""
Created on Mon Nov 10 20:12:23 2024

@author: SavingKing
"""

from graphviz import Digraph

g = Digraph('G', filename='cluster.gv', format='png')

# 注意:子圖的名稱必須以 'cluster'(全部小寫)開頭
#       這樣 Graphviz 才能將其識別為特殊的集群子圖
with g.subgraph(name='cluster_0') as c:
    #c.attr(style='filled', color='lightgrey')
    #c.node_attr.update(style='filled', color='white')
    c.edge('Router_1', 'Host_1')
    c.attr(label='process #1')

with g.subgraph(name='cluster_1') as c:
    #c.attr(color='blue')
    #c.node_attr['style'] = 'filled'
    c.edge('Router_2', 'Host_2')
    c.attr(label='process #2')

g.edge('Router_1', 'Router_2')
g.node('start', shape='Mdiamond') #,style='invis'
g.edge('start', 'Router_1') #,style='invis'
g.edge('start', 'Router_2') #,style='invis'
#g.edge('a1', 'b3')
g.edge('Router_2', 'Host_1') #,style='invis'
# g.edge('a3', 'a0')
# g.edge('a3', 'end')
# g.edge('b3', 'end')


# g.node('end', shape='Msquare')

g.view()
g.view()
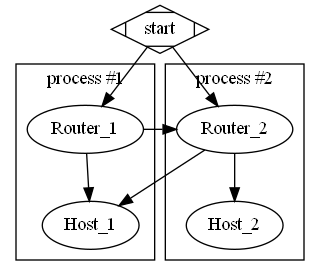
不要的部分,使用,style='invis'
即可隱藏
Router_1 跟 Host_1
因為字數不一樣
導致連接的edge傾斜graph_attr={'newrank': 'true'}
仍是正統做法
推薦hahow線上學習python: https://igrape.net/30afN
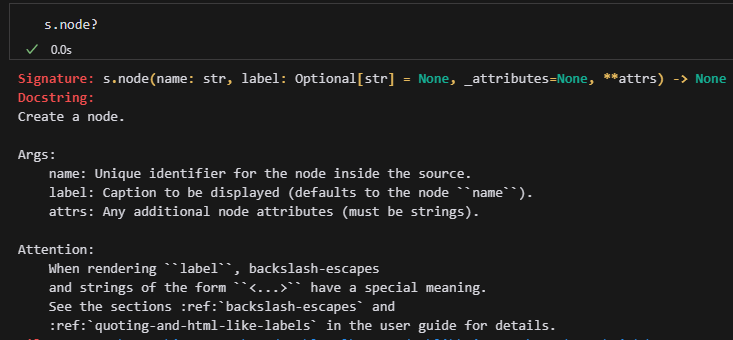
s.node?
[1;31mSignature:[0m [0ms[0m[1;33m.[0m[0mnode[0m[1;33m([0m[0mname[0m[1;33m:[0m [0mstr[0m[1;33m,[0m [0mlabel[0m[1;33m:[0m [0mOptional[0m[1;33m[[0m[0mstr[0m[1;33m][0m [1;33m=[0m [1;32mNone[0m[1;33m,[0m [0m_attributes[0m[1;33m=[0m[1;32mNone[0m[1;33m,[0m [1;33m**[0m[0mattrs[0m[1;33m)[0m [1;33m->[0m [1;32mNone[0m[1;33m[0m[1;33m[0m[0m
[1;31mDocstring:[0m
Create a node.
Args:
name: Unique identifier for the node inside the source.
label: Caption to be displayed (defaults to the node ``name``).
attrs: Any additional node attributes (must be strings).
Attention:
When rendering ``label``, backslash-escapes
and strings of the form ``<...>`` have a special meaning.
See the sections :ref:`backslash-escapes` and
:ref:`quoting-and-html-like-labels` in the user guide for details.
[1;31mFile:[0m c:\users\SavingKing\appdata\local\anaconda3\lib\site-packages\graphviz\dot.py
[1;31mType:[0m methods.node?
推薦hahow線上學習python: https://igrape.net/30afN



近期留言