import matplotlib.pyplot as plt
import numpy as np
x = np.linspace(0, 10, 100)
plt.plot(x, np.sin(x), label="sin(x)")
plt.plot(x, np.cos(x), label="cos(x)")
plt.legend(bbox_to_anchor=(1.05, 1.0), loc='upper left')
# plt.tight_layout()
plt.show()
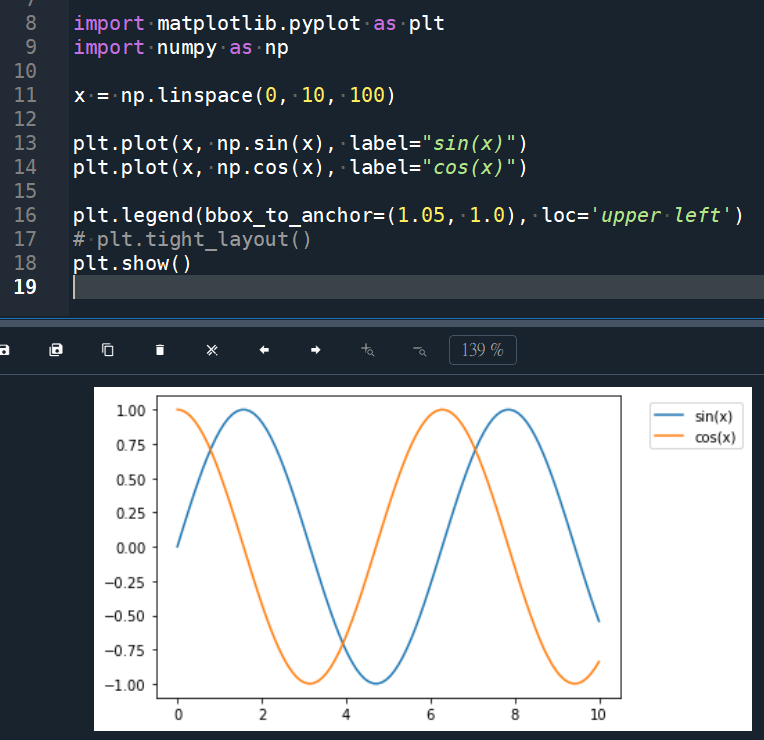
plt.tight_layout()
沒加這一行
Spyder沒出現裁切圖例的狀況
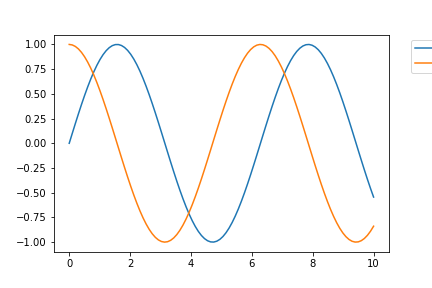
但是 plt.savefig(“bbox_to_anchor.png”)
儲存的檔案出現被裁切的狀況:
import matplotlib.pyplot as plt
import numpy as np
x = np.linspace(0, 10, 100)
plt.plot(x, np.sin(x), label="sin(x)")
plt.plot(x, np.cos(x), label="cos(x)")
lg = plt.legend(bbox_to_anchor=(1.05, 1.0), loc='upper left')
plt.savefig('example.png',
dpi=300,
format='png',
bbox_extra_artists=(lg,),
bbox_inches='tight')
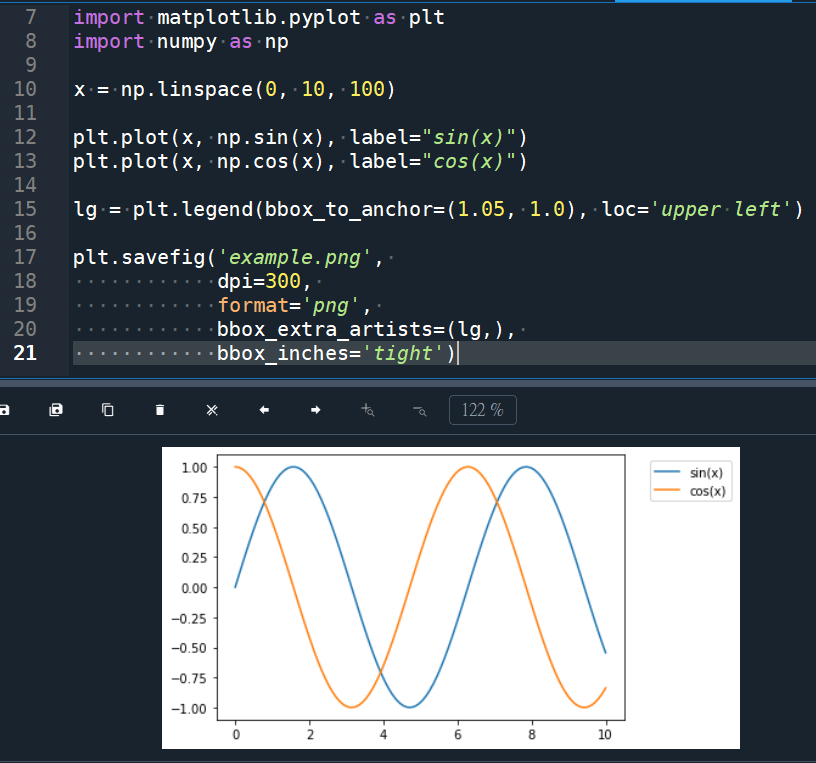
bbox_extra_artists 指定 Artist 的列表,該列表在計算緊湊 bbox 時會考慮在內。
如果將 bbox_inches 設定為 tight,它將計算出圖中的緊湊型 bbox。
推薦hahow線上學習python: https://igrape.net/30afN


![一文搞懂Python pandas.DataFrame去重:df.drop_duplicates() 與 df[~df.duplicated()] 的等價、差異與最佳實踐 一文搞懂Python pandas.DataFrame去重:df.drop_duplicates() 與 df[~df.duplicated()] 的等價、差異與最佳實踐](https://i0.wp.com/savingking.com.tw/wp-content/uploads/2025/08/20250808202701_0_66f9bc.png?quality=90&zoom=2&ssl=1&resize=350%2C233)


近期留言