import matplotlib.pyplot as plt
fig, ax = plt.subplots()
ax.plot([1, 2, 3], [1, 2, 3], label='Line 1')
ax.plot([1, 2, 3], [3, 2, 1], label='Line 2')
ax.legend()
#bbox_to_anchor=(1, 1), borderaxespad=0

這會生成一個包含兩條線條的圖表,並且圖例會被放在預設的位置。
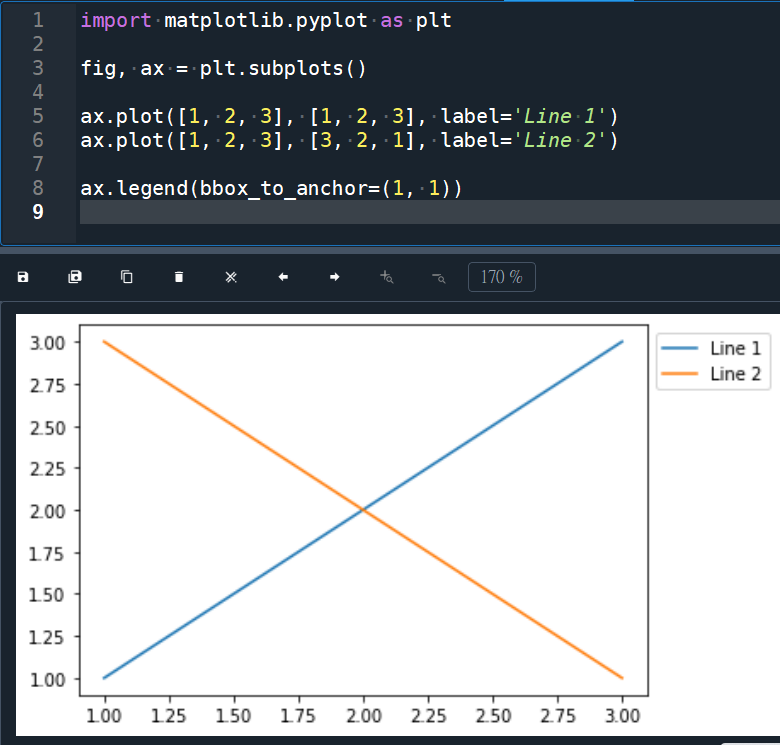
現在,我們想要把圖例放在右上角,可以使用 bbox_to_anchor 參數。
首先,我們需要先了解該參數的使用方式。
bbox_to_anchor 參數需要傳入一個二元組 (x, y),表示圖例的錨點位置。
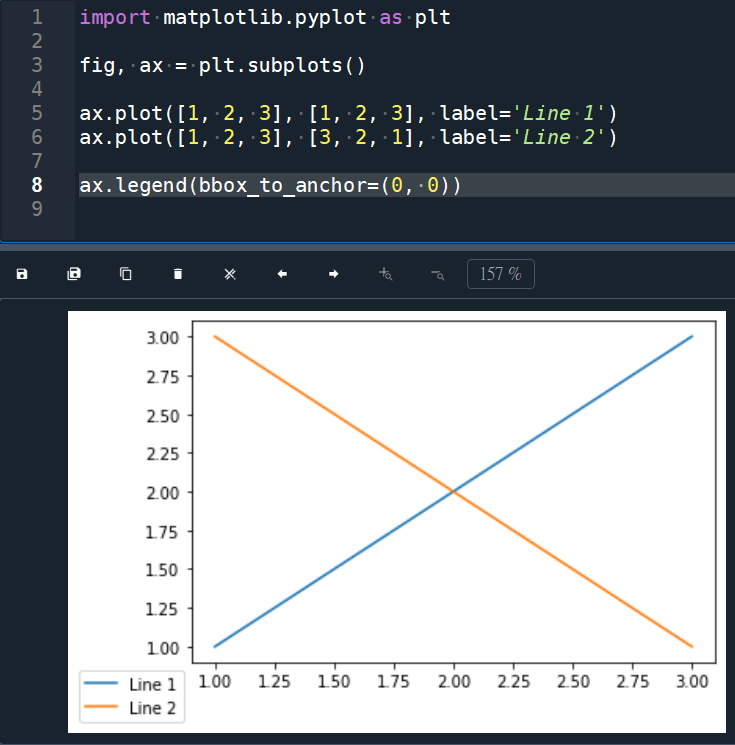
這個位置是相對於繪圖區域而言的,通常 (0, 0) 代表繪圖區域的左下角,
而 (1, 1) 則代表繪圖區域的右上角。
因此,如果我們要把圖例放在右上角,
可以將 bbox_to_anchor 參數設為 (1, 1),
表示圖例的錨點位置就在繪圖區域的右上角。
bbox_to_anchor=(0, 0):
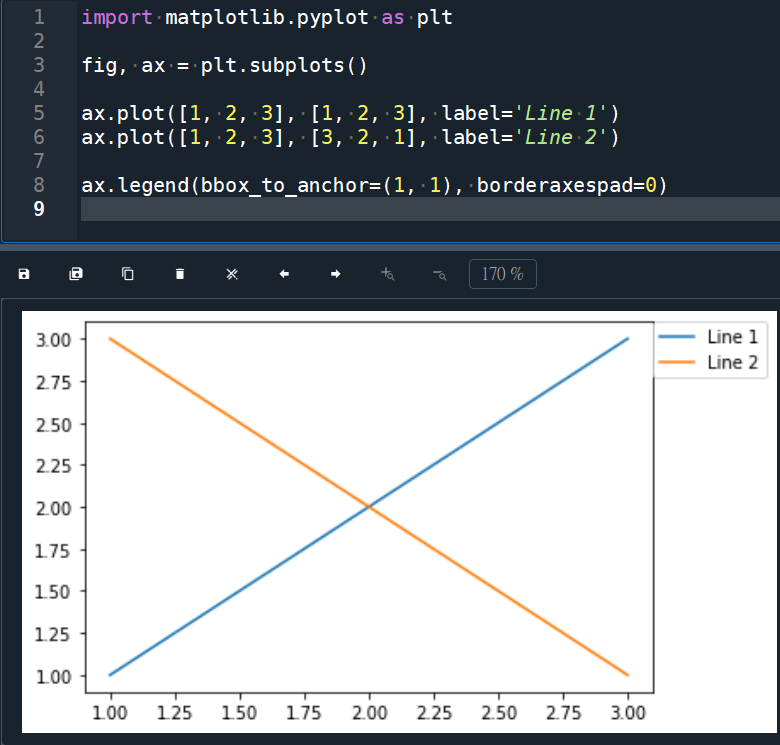
圖例和繪圖區域之間有一段距離,這是因為 Matplotlib 預設會給圖例留出一定的空間。如果我們不想要這段空間,可以再加上 borderaxespad 參數來指定空間的大小。
bbox 的英文原意是 “bounding box”,指的是一个包围某个对象的矩形框,
通常由左下角和右上角的坐标来确定。
在 Matplotlib 中,bbox 经常用于确定图形元素的位置和大小,
例如 legend 的位置可以通过设置 bbox 的左上角坐标和宽高来实现。
border axes pad
border: (legend的)邊界
pad: 軟墊
“pad” 的意思是 “填充” 或 “襯墊”。”border” 通常指周围的边框,”axes” 则指轴的范围。因此,”border axes pad” 的意思是轴范围与图例边界之间的填充量,即图例内部内容与周围边框之间的间隔距离。这个参数可以用来控制图例的位置和大小,使其与轴范围的位置和大小相匹配,同时保持一定的间隔。
推薦hahow線上學習python: https://igrape.net/30afN

 搜尋元素位於list中的那一個index")
 & 像and, 聯集(union) | 像or, 差集(difference)-像減法或not, 對稱差集(symmetric difference)^交集除外 xor")


, f.write(datanew)")
 ; 如何用numpy.polyfit() 做外插?")


近期留言