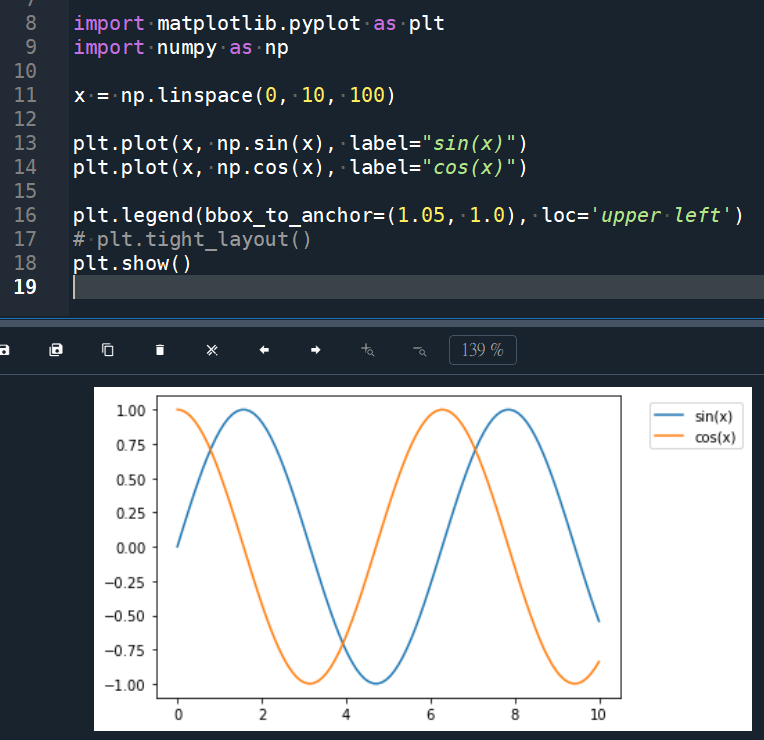
import matplotlib.pyplot as plt
import numpy as np
x = np.linspace(0, 10, 100)
plt.plot(x, np.sin(x), label="sin(x)")
plt.plot(x, np.cos(x), label="cos(x)")
plt.legend(bbox_to_anchor=(1.05, 1.0), loc='upper left')
# plt.tight_layout()
plt.show()
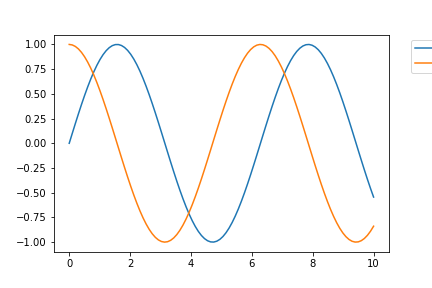
plt.tight_layout()
沒加這一行
Spyder沒出現裁切圖例的狀況
但是 plt.savefig(“bbox_to_anchor.png”)
儲存的檔案出現被裁切的狀況:
import matplotlib.pyplot as plt
import numpy as np
x = np.linspace(0, 10, 100)
plt.plot(x, np.sin(x), label="sin(x)")
plt.plot(x, np.cos(x), label="cos(x)")
lg = plt.legend(bbox_to_anchor=(1.05, 1.0), loc='upper left')
plt.savefig('example.png',
dpi=300,
format='png',
bbox_extra_artists=(lg,),
bbox_inches='tight')
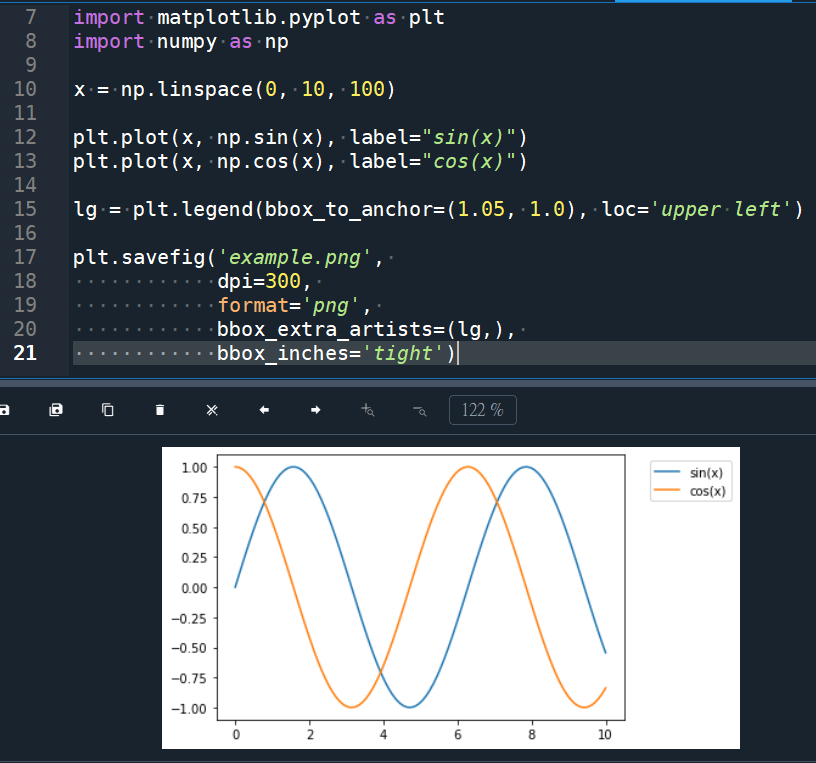
bbox_extra_artists 指定 Artist 的列表,該列表在計算緊湊 bbox 時會考慮在內。
如果將 bbox_inches 設定為 tight,它將計算出圖中的緊湊型 bbox。
推薦hahow線上學習python: https://igrape.net/30afN

? import matplotlib.pyplot as plt; fig, ax = plt.subplots(1,1) ; plt.minorticks_on() ; ax.grid(visible=True, which=”major”, c=”k”, linewidth=1) ; ax.grid(visible=True, which=”minor”, c=”k”, linewidth=0.5)")
")
![Python: 如何使用pandas.to_numeric ( df[‘numbers’], errors=’coerce’) 將非數值型資料轉為NaN? df[‘numbers’].describe() 簡述統計資料](https://i0.wp.com/savingking.com.tw/wp-content/uploads/2024/05/20240501052102_0.png?quality=90&zoom=2&ssl=1&resize=350%2C233 "Python: 如何使用pandas.to_numeric ( df[‘numbers’], errors=’coerce’) 將非數值型資料轉為NaN? df[‘numbers’].describe() 簡述統計資料")
如何設定sep參數才能讀取分隔子同時有, ” ” (空白)的csv檔? df = pd.read_csv(‘test.txt’, sep = ‘\s*,\s*|\s+’, engine=’python’)")
: value for key, value in kwargs.items()}")
 對字典重新排序? dict.pop() #刪除key,回傳value")
 ; from sklearn.neighbors import KNeighborsClassifier ; from sklearn.model_selection import train_test_split")
 ; median_np = numpy .nanmedian(arr)")

近期留言