網址列輸入:
chrome://settings/help

版本 118.0.5993.89 (正式版本) (64 位元)
chrome://version/
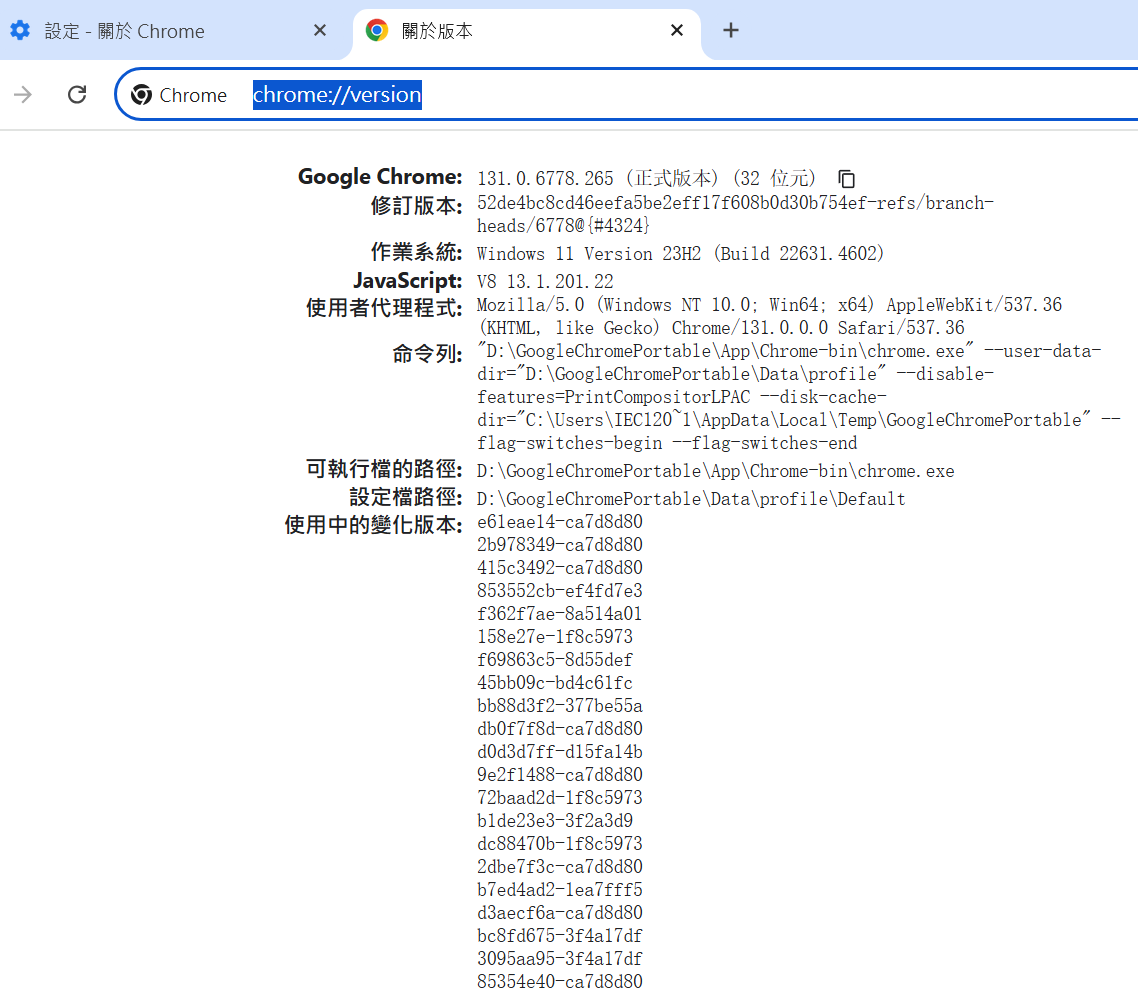
portable: 131.0.6778.265 (正式版本) (32 位元)
或者如下操作:

到Google Chrome Lab 尋找對應的Chrome Driver
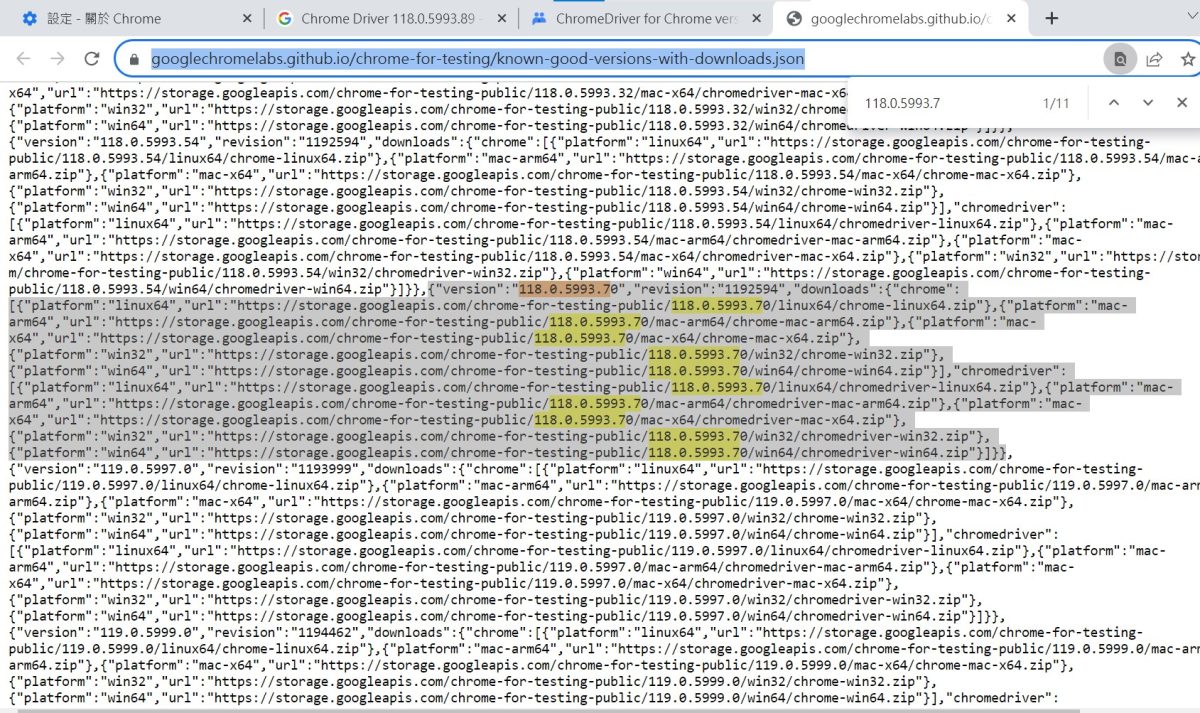
找不到完全一樣的,
最接近的是:
118.0.5993.70
"chromedriver":
[{"platform":"linux64","url":"https://storage.googleapis.com/chrome-for-testing-public/118.0.5993.70/linux64/chromedriver-linux64.zip"},
{"platform":"mac-arm64","url":"https://storage.googleapis.com/chrome-for-testing-public/118.0.5993.70/mac-arm64/chromedriver-mac-arm64.zip"},
{"platform":"mac-x64","url":"https://storage.googleapis.com/chrome-for-testing-public/118.0.5993.70/mac-x64/chromedriver-mac-x64.zip"},
{"platform":"win32","url":"https://storage.googleapis.com/chrome-for-testing-public/118.0.5993.70/win32/chromedriver-win32.zip"},
{"platform":"win64","url":"https://storage.googleapis.com/chrome-for-testing-public/118.0.5993.70/win64/chromedriver-win64.zip"}]}}{“platform”:”win64″,”url”:”https://storage.googleapis.com/chrome-for-testing-public/118.0.5993.70/win64/chromedriver-win64.zip“}
推薦hahow線上學習python: https://igrape.net/30afN


中 if 的位置差異; if 放在後面 (過濾條件) ; if 放在前面 (三元運算符)")
 ; glob.glob() #讀取資料夾中的所有檔案 ; os.path.split(fpath) = os.path.dirname(fpath) , os.path.basename(fpath) ; os.path.splitext(basename) #分離主/副檔名")
、ravel()與reshape(-1)的完整指南 #flatten(): 總是建立副本")

生成pandas.DataFrame?")
 #獲取時間戳; localtime = time.localtime( timestamp ) #獲取localtime; fmt= ‘%Y-%m-%d %H:%M:%S’ ; strftime = time.strftime(fmt, localtime) 等效於 datetime.datetime.now().strftime(fmt) #獲取strftime #str format time ;")
=TURE與IFERROR函數;IF ISNA()=TURE與IFNA函數")


近期留言