import pandas as pd
import matplotlib.pyplot as plt

# 示例數據
data = {
    'fixture': ['F1', 'F1', 'F1', 'F2', 'F2', 'F2', 'F3', 'F3', 'F3', 'F3'],
    'value': [10, 12, 14, 15, 18, 20, 21, 22, 24, 30],
}

# 創建 DataFrame
df = pd.DataFrame(data)

# 創建一個 Matplotlib 圖表和軸
fig, ax = plt.subplots(figsize=(8, 6))
#fig, ax = plt.subplots(1,1,figsize=(8, 6)) #等效

# 繪製盒鬚圖,並將它繪製到指定的軸上
df.boxplot(column='value', by='fixture',
grid=False, showmeans=True,showfliers=True,ax=ax)


# 添加標題和標籤
ax.set_title('Box Plot of Values by Fixture')
ax.set_xlabel('Fixture')
ax.set_ylabel('Value')

# 去掉默認副標題
fig.suptitle("")
"""
在 Matplotlib 中的 "sup"
在 Matplotlib 的 suptitle 中,"sup" 是 "superior"(上方、上層)的縮寫。

suptitle 的意思是「圖表的全局標題」,因為它位於整個圖表的上方。
直譯為:「上方的標題」。
#不是 fig.subtitle("")
"""

# 顯示圖表
plt.show()
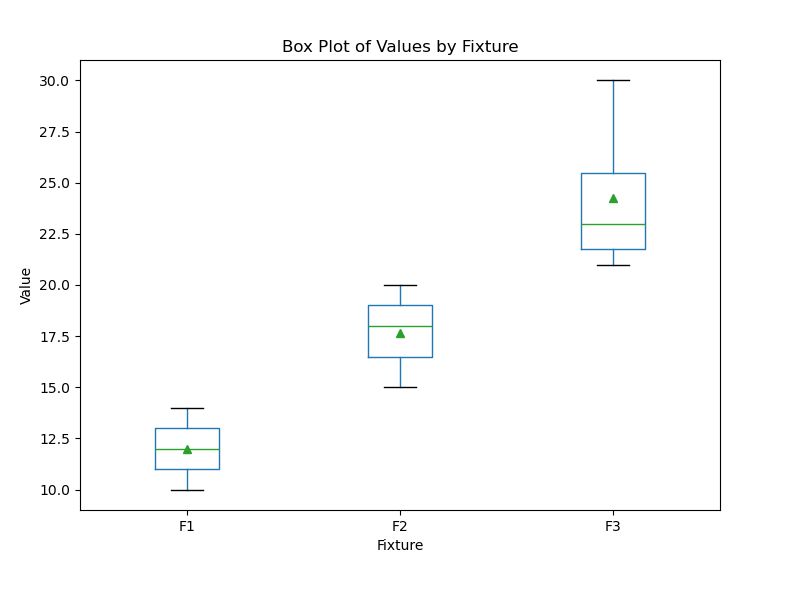
輸出結果:
推薦hahow線上學習python: https://igrape.net/30afN
code(有問題):
import pandas as pd
import matplotlib.pyplot as plt

# 假設 pivot_RPM 是一個多層索引的樞紐表
#(例如包含 min, max, mean, std, count 等)
# 這裡是模擬的 pivot_RPM 示例數據
data = {
    ('min', '015EVP20'): [37000, 36000, 35000],
    ('max', '015EVP20'): [45000, 44000, 46000],
    ('median', '015EVP20'): [41000, 40000, 40500],
    ('quantile_25', '015EVP20'): [39000, 38000, 39000],
    ('quantile_75', '015EVP20'): [43000, 42000, 44000],
    ('min', '015EVP21'): [36000, 35000, 36000],
    ('max', '015EVP21'): [44000, 43000, 45000],
    ('median', '015EVP21'): [40000, 39000, 39500],
    ('quantile_25', '015EVP21'): [38000, 37000, 38000],
    ('quantile_75', '015EVP21'): [42000, 41000, 43000],
}
index = ['CPU0_CH0_D0', 'CPU0_CH0_D1', 'CPU0_CH1_D0']
pivot_RPM = pd.DataFrame(data, index=index)

# 提取 fixture 名稱
fixtures = ['015EVP20', '015EVP21']

# 繪製盒鬚圖
fig, ax = plt.subplots(figsize=(10, 6))

for fixture in fixtures:
    # 提取每個 fixture 的統計數據
    min_values = pivot_RPM[('min', fixture)]
    max_values = pivot_RPM[('max', fixture)]
    median_values = pivot_RPM[('median', fixture)]
    q1_values = pivot_RPM[('quantile_25', fixture)]
    q3_values = pivot_RPM[('quantile_75', fixture)]

    # 構造盒鬚圖所需的數據
    box_data = {
        'whislo': min_values,  # 下鬚(最小值)
        'q1': q1_values,       # 第一四分位數
        'med': median_values,  # 中位數
        'q3': q3_values,       # 第三四分位數
        'whishi': max_values,  # 上鬚(最大值)
    }

    # 將每個 fixture 的數據繪製成盒鬚圖
    ax.bxp([{
        'whislo': box_data['whislo'][i],
        'q1': box_data['q1'][i],
        'med': box_data['med'][i],
        'q3': box_data['q3'][i],
        'whishi': box_data['whishi'][i],
        'label': f"{fixture} - {pivot_RPM.index[i]}"
    } for i in range(len(pivot_RPM))], showfliers=False)

# 添加圖表標題和坐標軸標籤
ax.set_title("Boxplot Based on Pivot_RPM")
ax.set_xlabel("Name and Fixture")
ax.set_ylabel("RPM Value")
plt.xticks(rotation=45)
plt.tight_layout()
plt.show()
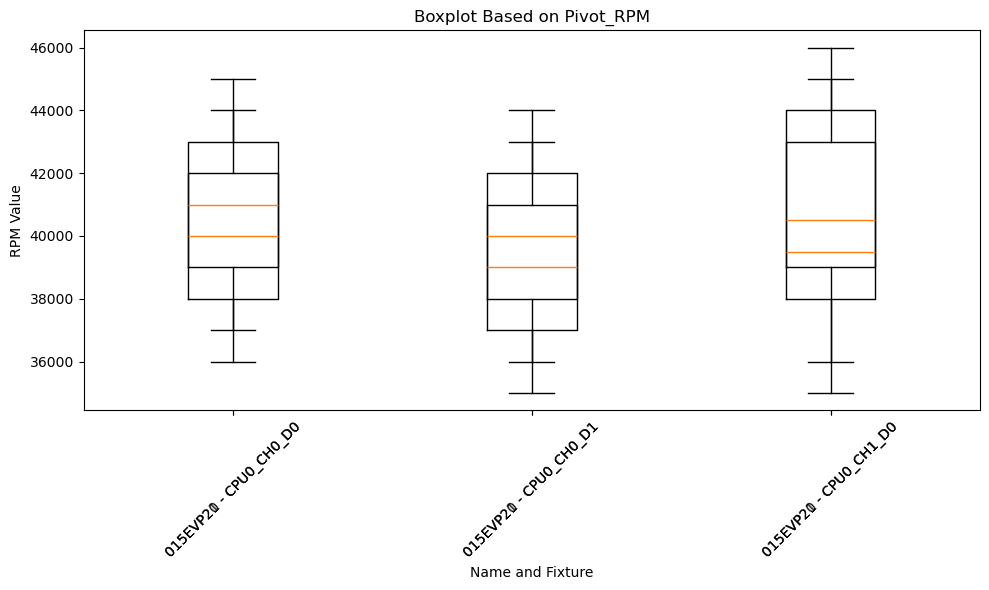
輸出結果(不正常):
修訂code:
import pandas as pd
import matplotlib.pyplot as plt

# 模擬 pivot_RPM 示例數據
data = {
    ('min', '015EVP20'): [37000, 36000, 35000],
    ('max', '015EVP20'): [45000, 44000, 46000],
    ('median', '015EVP20'): [41000, 40000, 40500],
    ('quantile_25', '015EVP20'): [39000, 38000, 39000],
    ('quantile_75', '015EVP20'): [43000, 42000, 44000],
    ('min', '015EVP21'): [36000, 35000, 36000],
    ('max', '015EVP21'): [44000, 43000, 45000],
    ('median', '015EVP21'): [40000, 39000, 39500],
    ('quantile_25', '015EVP21'): [38000, 37000, 38000],
    ('quantile_75', '015EVP21'): [42000, 41000, 43000],
}
index = ['CPU0_CH0_D0', 'CPU0_CH0_D1', 'CPU0_CH1_D0']
pivot_RPM = pd.DataFrame(data, index=index)

# 提取 fixture 名稱
fixtures = ['015EVP20', '015EVP21']

# 繪製盒鬚圖
fig, ax = plt.subplots(figsize=(10, 6))

# 構造盒鬚圖的數據
boxplot_data = []

for fixture in fixtures:
    # 提取每個 fixture 的統計數據
    min_values = pivot_RPM[('min', fixture)]
    max_values = pivot_RPM[('max', fixture)]
    median_values = pivot_RPM[('median', fixture)]
    q1_values = pivot_RPM[('quantile_25', fixture)]
    q3_values = pivot_RPM[('quantile_75', fixture)]

    # 將每個行索引的數據組裝為單個盒鬚圖數據
    for i in range(len(pivot_RPM)):
        boxplot_data.append({
            'whislo': min_values[i],  # 下鬚(最小值)
            'q1': q1_values[i],       # 第一四分位數
            'med': median_values[i],  # 中位數
            'q3': q3_values[i],       # 第三四分位數
            'whishi': max_values[i],  # 上鬚(最大值)
            'label': f"{fixture} - {pivot_RPM.index[i]}"
        })

# 一次性繪製所有盒鬚圖
ax.bxp(boxplot_data, showfliers=False)

# 添加圖表標題和坐標軸標籤
ax.set_title("Boxplot Based on Pivot_RPM")
ax.set_xlabel("Name and Fixture")
ax.set_ylabel("RPM Value")
plt.xticks(rotation=45)
plt.tight_layout()
plt.show()
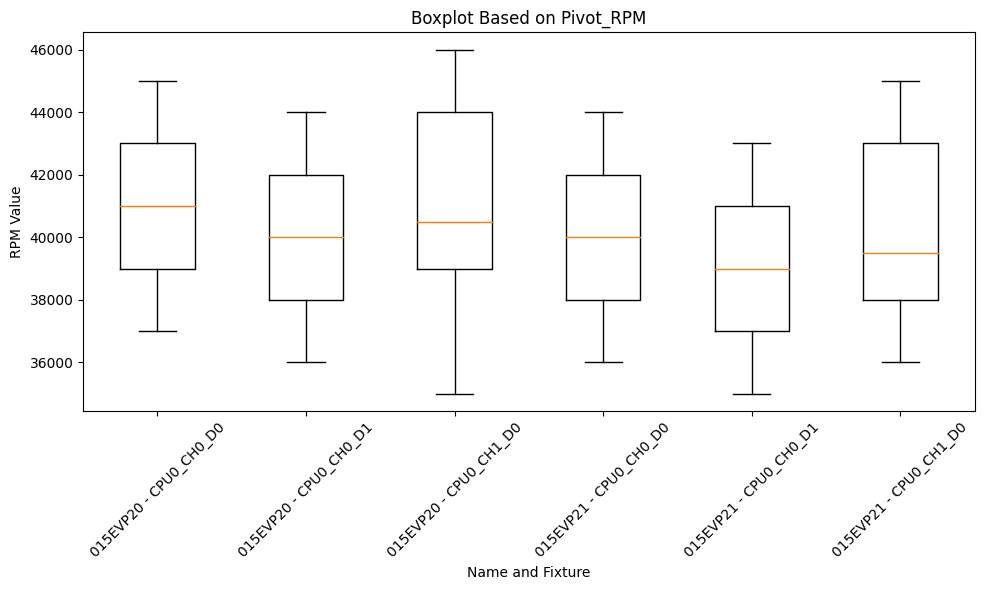
輸出結果:
修訂code(輸出圖片檔):
import pandas as pd
import matplotlib.pyplot as plt

# 假設 pivot_RPM 是一個多層索引的樞紐表
# 模擬的 pivot_RPM 示例數據
data = {
    ('min', '015EVP20'): [37000, 36000, 35000],
    ('max', '015EVP20'): [45000, 44000, 46000],
    ('median', '015EVP20'): [41000, 40000, 40500],
    ('quantile_25', '015EVP20'): [39000, 38000, 39000],
    ('quantile_75', '015EVP20'): [43000, 42000, 44000],
    ('min', '015EVP21'): [36000, 35000, 36000],
    ('max', '015EVP21'): [44000, 43000, 45000],
    ('median', '015EVP21'): [40000, 39000, 39500],
    ('quantile_25', '015EVP21'): [38000, 37000, 38000],
    ('quantile_75', '015EVP21'): [42000, 41000, 43000],
}
index = ['CPU0_CH0_D0', 'CPU0_CH0_D1', 'CPU0_CH1_D0']
pivot_RPM = pd.DataFrame(data, index=index)

# 提取 fixture 名稱
fixtures = ['015EVP20', '015EVP21']

# 對每個 fixture 單獨繪製並保存圖片
for fixture in fixtures:
    # 創建新的圖表
    fig, ax = plt.subplots(figsize=(10, 6))

    # 提取該 fixture 的統計數據
    min_values = pivot_RPM[('min', fixture)]
    max_values = pivot_RPM[('max', fixture)]
    median_values = pivot_RPM[('median', fixture)]
    q1_values = pivot_RPM[('quantile_25', fixture)]
    q3_values = pivot_RPM[('quantile_75', fixture)]

    # 構造盒鬚圖所需的數據
    box_data = {
        'whislo': min_values,  # 下鬚(最小值)
        'q1': q1_values,       # 第一四分位數
        'med': median_values,  # 中位數
        'q3': q3_values,       # 第三四分位數
        'whishi': max_values,  # 上鬚(最大值)
    }

    # 繪製該 fixture 的盒鬚圖
    ax.bxp([{
        'whislo': box_data['whislo'][i],
        'q1': box_data['q1'][i],
        'med': box_data['med'][i],
        'q3': box_data['q3'][i],
        'whishi': box_data['whishi'][i],
        'label': pivot_RPM.index[i]  # 使用索引作為標籤
    } for i in range(len(pivot_RPM))], showfliers=False)

    # 添加圖表標題和坐標軸標籤
    ax.set_title(f"Boxplot for Fixture {fixture}")
    ax.set_xlabel("Name")
    ax.set_ylabel("RPM Value")
    plt.xticks(rotation=45)
    plt.tight_layout()

    # 保存圖片
    output_filename = f"boxplot_{fixture}.png"
    plt.savefig(output_filename)  # 將圖片保存為 PNG 文件
    print(f"Saved boxplot for {fixture} as {output_filename}")

    # 關閉當前圖表,避免重疊
    plt.close()
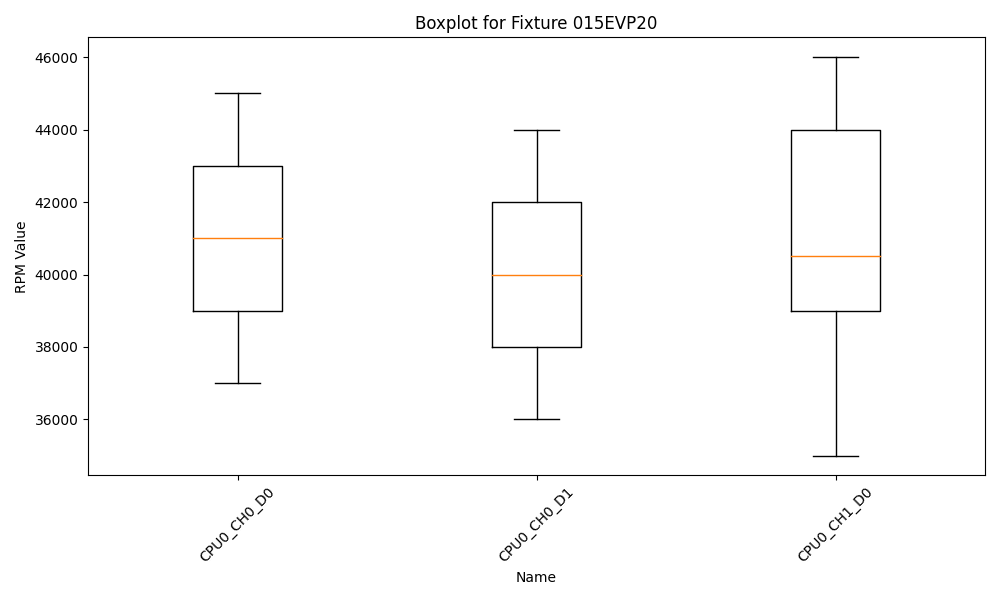
輸出兩個圖片檔:
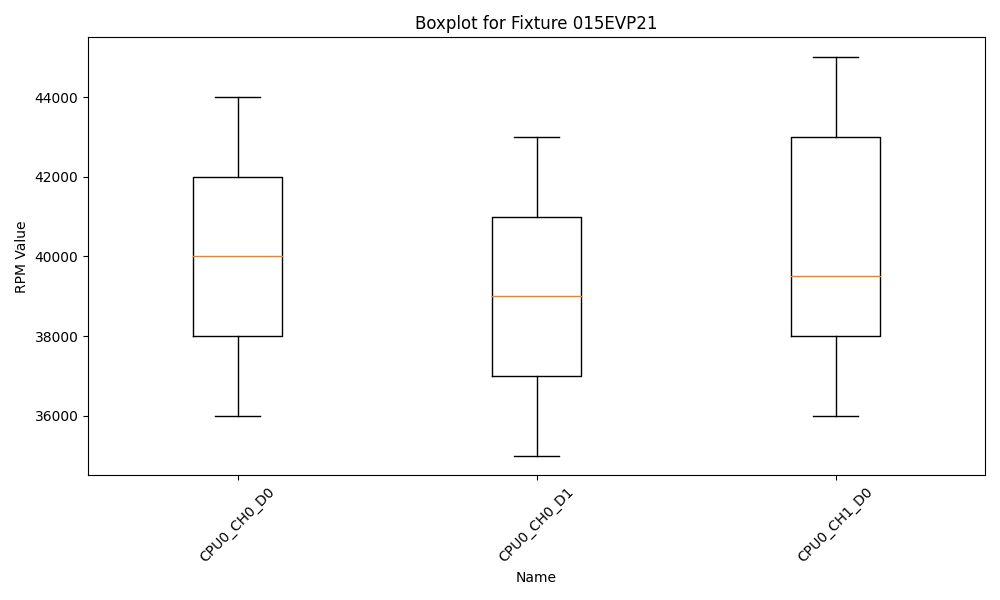
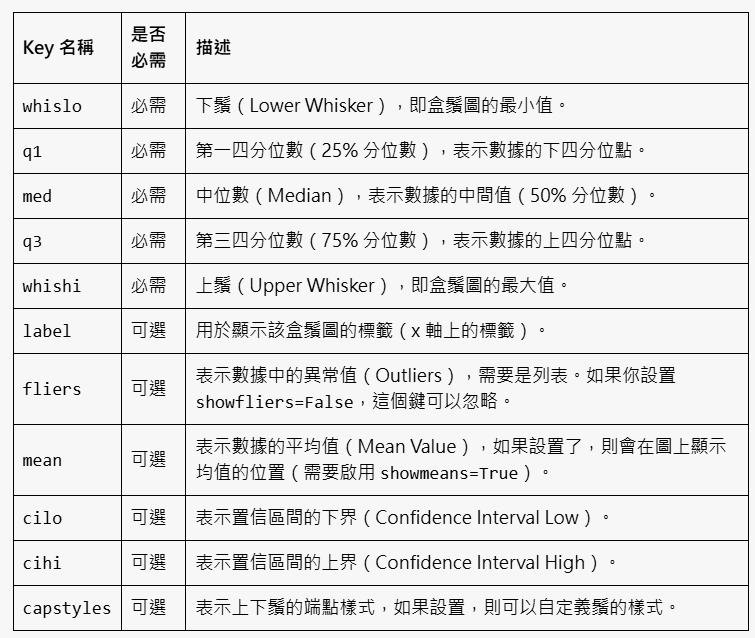
ax.bxp 方法所接受的字典結構中,key 的名稱是固定的,因為 Matplotlib 的 bxp 函數需要根據特定的鍵名來正確解釋繪製盒鬚圖所需的數據。這些鍵名是 Matplotlib 的內置規範,不能更改。
bxp 函數支持的固定鍵名
以下是 bxp 函數支持的所有鍵名,以及它們的作用和意義:
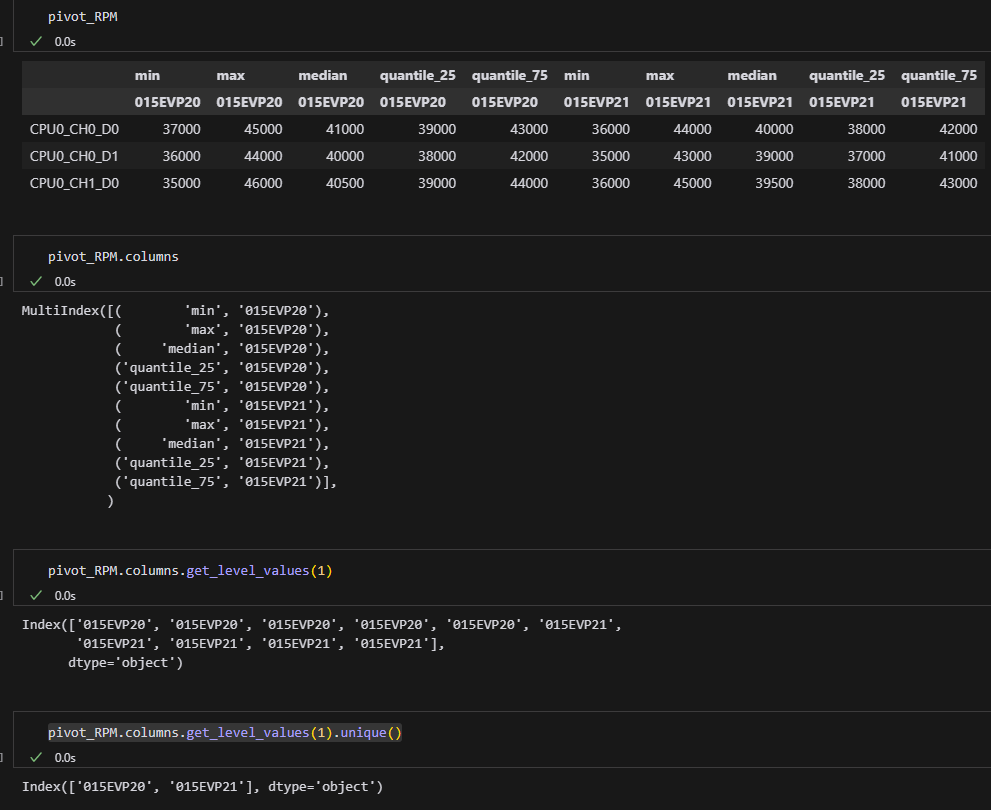
pivot_RPM.columns.get_level_values(1).unique()
獲取第二層index的內容:
部分code:
def quantile_25(x):
    if len(x) == 0:  # 如果輸入的分組為空
        return np.nan
    return np.percentile(x, 25)

def quantile_75(x):
    if len(x) == 0:  # 如果輸入的分組為空
        return np.nan
    return np.percentile(x, 75)

pivot_RPM = pd.pivot_table(df_ex, values='value', index='name', columns='fixture',
    aggfunc=["min","max","mean", "std", "count", "median", quantile_25, quantile_75 ])
df若是從pd.pivot_table() 生成
MultiIndex 會帶有name (如:fixture)
則get_level_values(1)改用name定位
推薦hahow線上學習python: https://igrape.net/30afN
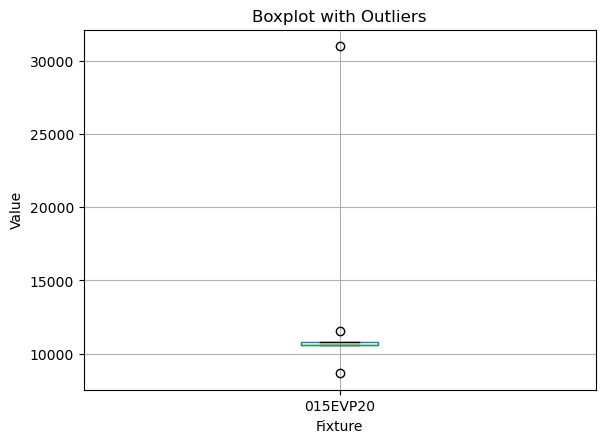
已經做過樞紐分析的DF
showfliers參數無效,
需要用尚未樞紐分析過的Raw資料,
showfliers參數才有用
code(showfliers=True):
import pandas as pd
import matplotlib.pyplot as plt

# 模擬數據
data = {
    'fixture': ['015EVP20', '015EVP20', '015EVP20',
    '015EVP20', '015EVP20', '015EVP20', '015EVP20', '015EVP20'],
    'name': ['SYS_FAN_0A'] * 8,
    'value': [11556, 10576, 10576, 10576,
    10576, 10576, 8654, 31001]  # 觀測數值
}
df = pd.DataFrame(data)

# 繪製箱型圖
plt.figure(figsize=(8, 6))
df.boxplot(column='value', by='fixture', showfliers=True)  # 顯示異常值
plt.title("Boxplot with Outliers")
plt.suptitle("")  # 移除默認副標題
plt.ylabel("Value")
plt.xlabel("Fixture")
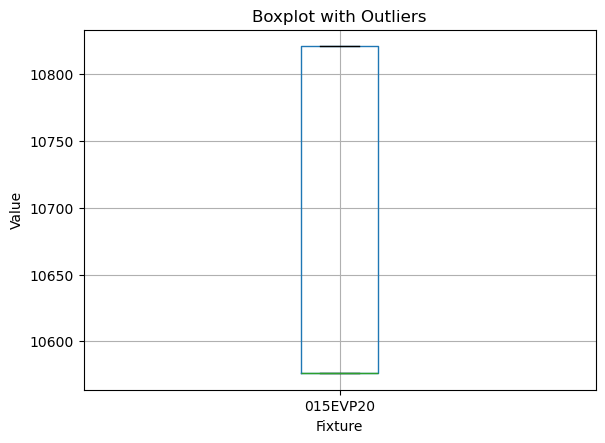
plt.show()輸出結果(showfliers=True):
輸出結果(showfliers=False):


![Python: matplotlib繪製出的圖表如何插入背景圖? img = plt.imread(‘background_image.png’) ; ax.imshow(img, extent=[0, 10, -1.2, 1.2], aspect=’auto’, alpha=0.5) Python: matplotlib繪製出的圖表如何插入背景圖? img = plt.imread(‘background_image.png’) ; ax.imshow(img, extent=[0, 10, -1.2, 1.2], aspect=’auto’, alpha=0.5)](https://i0.wp.com/savingking.com.tw/wp-content/uploads/2023/02/20230216183536_29.png?quality=90&zoom=2&ssl=1&resize=350%2C233)


![Python: 如何將folder_name, file_name合併為file_path? fpath = os.path .join(folder, fname) ; “\\”.join([folder, fname]) ; 如何將file_path拆分出folder? Python: 如何將folder_name, file_name合併為file_path? fpath = os.path .join(folder, fname) ; “\\”.join([folder, fname]) ; 如何將file_path拆分出folder?](https://i0.wp.com/savingking.com.tw/wp-content/uploads/2023/03/20230330132954_84.png?quality=90&zoom=2&ssl=1&resize=350%2C233)


近期留言