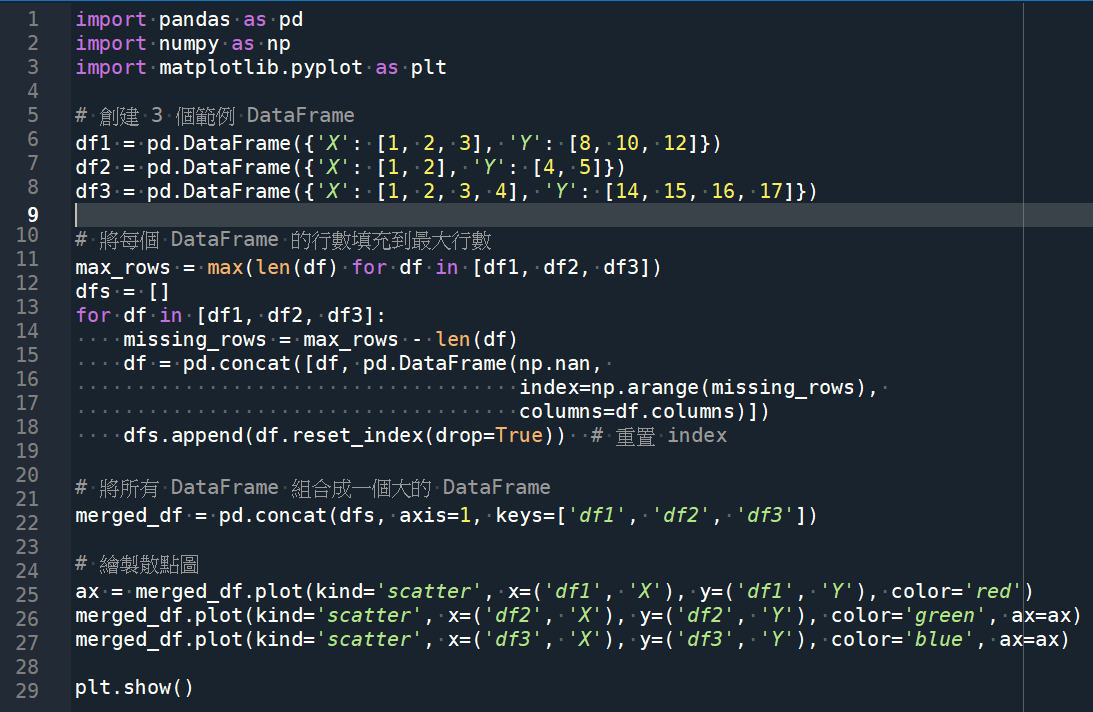
import pandas as pd
import numpy as np
import matplotlib.pyplot as plt
# 創建 3 個範例 DataFrame
df1 = pd.DataFrame({‘X’: [1, 2, 3], ‘Y’: [8, 10, 12]})
df2 = pd.DataFrame({‘X’: [1, 2], ‘Y’: [4, 5]})
df3 = pd.DataFrame({‘X’: [1, 2, 3, 4], ‘Y’: [14, 15, 16, 17]})
# 將每個 DataFrame 的行數填充到最大行數
max_rows = max(len(df) for df in [df1, df2, df3])
dfs = []
for df in [df1, df2, df3]:
missing_rows = max_rows – len(df)
df = pd.concat([df, pd.DataFrame(np.nan,
index=np.arange(missing_rows),
columns=df.columns)])
dfs.append(df.reset_index(drop=True)) # 重置 index
# 將所有 DataFrame 組合成一個大的 DataFrame
merged_df = pd.concat(dfs, axis=1, keys=[‘df1’, ‘df2’, ‘df3’])
# 繪製散點圖
ax = merged_df.plot(kind=’scatter’, x=(‘df1’, ‘X’), y=(‘df1’, ‘Y’), color=’red’)
merged_df.plot(kind=’scatter’, x=(‘df2’, ‘X’), y=(‘df2’, ‘Y’), color=’green’, ax=ax)
merged_df.plot(kind=’scatter’, x=(‘df3’, ‘X’), y=(‘df3’, ‘Y’), color=’blue’, ax=ax)
plt.show()
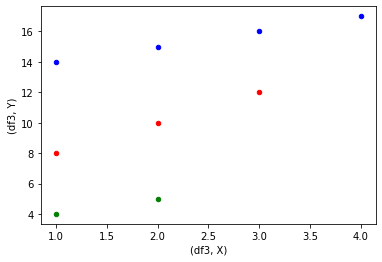
輸出結果:
推薦hahow線上學習python: https://igrape.net/30afN

")
")

; from bs4 import BeautifulSoup")
 ; json的保留字:null, true, false(區分大小寫,全小寫), null(非”null”,非Null)自動轉譯為None, true(非”true”,非True)自動轉譯為True(bool), false(非”false”,非False)自動轉譯為False(bool);colab如何掛載雲端硬碟? from google.colab import drive ; json檔的decode與encode? json.load() ; json.loads() ; json.dump() ; json.dumps() #s代表string的意思,有s的指令,參數需使用str type")
 正向先行 ; (?!pattern) 負向先行 ; (?<=pattern) 正向回顧 ; (?<!pattern) 負向回顧 ; (? 往後(右)看 ; (?< 往前(左)看 ; =必須符合 ; !不可符合")
![Python 讀取 DOCX 圖片關聯:qn+find/findall 與 XPath 的實戰對照 from lxml import etree ; from docx.oxml.ns import qn; lxml.etree._Element.findall( f”.//{ qn(‘a:blip’) }” ) ; .get( qn(“r:embed”) ) #獲取 屬性名 ‘r:embed’ 的 屬性值(如: ‘rId4’) ; lxml.etree._Element.xpath( “//a:blip/@r:embed”, namespaces = NS) #/@r:embed = 獲取 屬性名 ‘r:embed’ 的 屬性值(如: ‘rId4’),使用.findall() 要先.findall()獲取List[_Element],再迴圈_Element.get()獲取屬性值, .xpath() 第一個參數path 使用”//a:blip/@r:embed” ,可直接獲取屬性值(List[str]如: [‘rId4’, ‘rId5’]) ; 如何對docx真實移除圖片瘦身?](https://i2.wp.com/savingking.com.tw/wp-content/uploads/2025/11/20251119130848_0_3fbf6b.png?quality=90&zoom=2&ssl=1&resize=350%2C233 "Python 讀取 DOCX 圖片關聯:qn+find/findall 與 XPath 的實戰對照 from lxml import etree ; from docx.oxml.ns import qn; lxml.etree._Element.findall( f”.//{ qn(‘a:blip’) }” ) ; .get( qn(“r:embed”) ) #獲取 屬性名 ‘r:embed’ 的 屬性值(如: ‘rId4’) ; lxml.etree._Element.xpath( “//a:blip/@r:embed”, namespaces = NS) #/@r:embed = 獲取 屬性名 ‘r:embed’ 的 屬性值(如: ‘rId4’),使用.findall() 要先.findall()獲取List[_Element],再迴圈_Element.get()獲取屬性值, .xpath() 第一個參數path 使用”//a:blip/@r:embed” ,可直接獲取屬性值(List[str]如: [‘rId4’, ‘rId5’]) ; 如何對docx真實移除圖片瘦身?")
: stack() ; unstack() #可用idxmax()求最大值的index/columns ; groupby().mean().reset_index() ; pivot() ; pivot_table( aggfunc = np.mean ) ; set_index() ; pivot_table = groupby + pivot #pivot_table() 有aggfunc參數,所以索引組合可以重複,pivot則無此參數,若有重複的索引組合,需要先用groupby().mean()")


近期留言