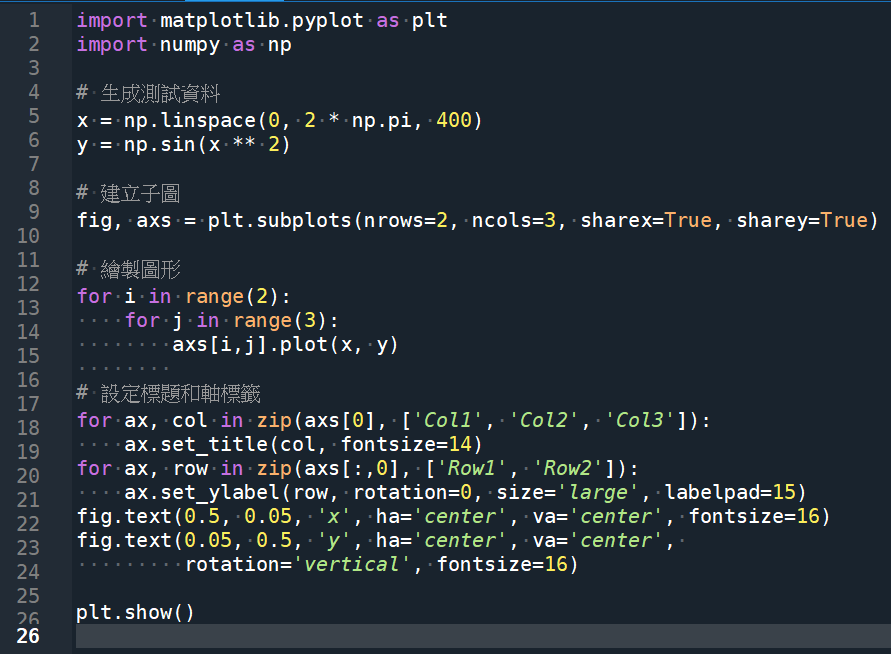
import matplotlib.pyplot as plt
import numpy as np
# 生成測試資料
x = np.linspace(0, 2 * np.pi, 400)
y = np.sin(x ** 2)
# 建立子圖
fig, axs = plt.subplots(nrows=2, ncols=3, sharex=True, sharey=True)
# 繪製圖形
for i in range(2):
for j in range(3):
axs[i,j].plot(x, y)
# 設定標題和軸標籤
for ax, col in zip(axs[0], [‘Col1’, ‘Col2’, ‘Col3’]):
ax.set_title(col, fontsize=14)
for ax, row in zip(axs[:,0], [‘Row1’, ‘Row2’]):
ax.set_ylabel(row, rotation=0, size=’large’, labelpad=15)
#
labelpad 是指定刻度标签和轴线(或其他元素)之间的间距。# 例如,如果设置 labelpad=10,则标签和轴线之间的间距为 10 点大小。
fig.text(0.5, 0.05, ‘x’, ha=’center’, va=’center’, fontsize=16)
fig.text(0.05, 0.5, ‘y’, ha=’center’, va=’center’,
rotation=’vertical’, fontsize=16)
plt.show()
輸出:
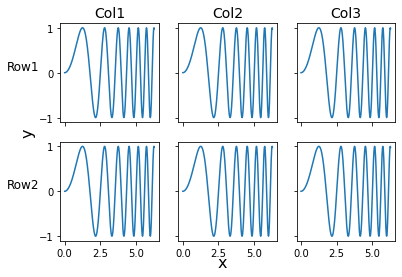
使用suplabel共用x y label:
import matplotlib.pyplot as plt
import numpy as np
# 创建 3 个子图
fig, axs = plt.subplots(nrows=3, ncols=2, figsize=(8, 8))
# 在每个子图上绘制一个简单的曲线
for i in range(3):
for j in range(2):
x = np.linspace(0, 2*np.pi, 100)
y = np.sin((i+1)*x + j*np.pi/2)
axs[i,j].plot(x, y)
# 添加共同的 x 标签
plt.suplabel(‘X Label’, ‘x’)
# 添加共同的 y 标签
plt.suplabel(‘Y Label’, ‘y’)
plt.show()
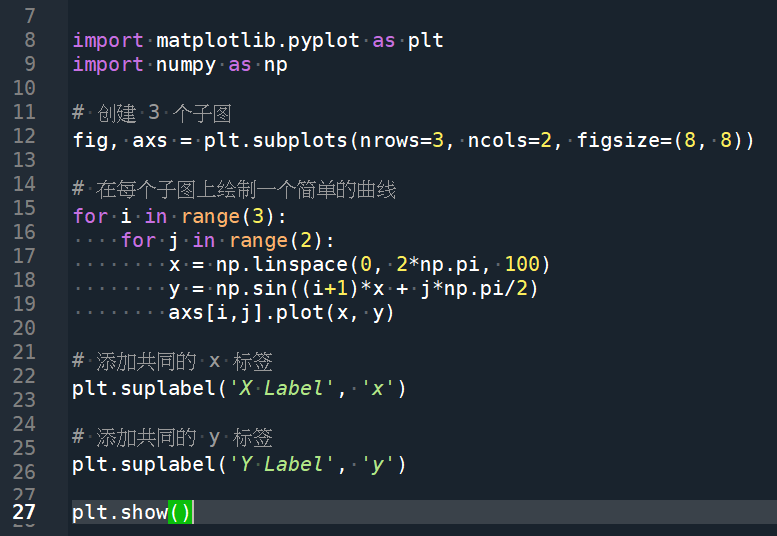
輸出:

 ; set1 = set(dic) #2D list可以轉為dict, dict的key可以轉為set")
 ; df.set_index() 將兩欄的df,其中一欄設為index後,其型態是單欄的DataFrame還是Series?")
的Button?一按就刪除掉Label + Entry + Button ; trash_icon = tk.PhotoImage( file = trash_icon_path)")
 ; 如何重置欄index? DataFrame的屬性與方法 .values ; .to_numpy()")
 ; from docx.document import Document as DocxDocument #類別,非function ; from docx.table import _Cell, Table #儲存格/表格 類別")
,計算新光人壽美添109 IRR,免費下載IRR計算機")
 ; glob.glob() #讀取資料夾中的所有檔案 ; os.path.split(fpath) = os.path.dirname(fpath) , os.path.basename(fpath) ; os.path.splitext(basename) #分離主/副檔名")
 ) ; for idx, sea in enumerate (seasons, start=1): print(idx,sea)")
與numpy.poly1d()做多項式曲線擬和; matplotlib 如何變更legend圖例字型大小? plt.rc(“legend”, fontsize=16) ; ax.legend(loc = “best”, fontsize=16, handlelength=0.5, frameon = False)")

近期留言