


import matplotlib.pyplot as plt

x = [1, 2, 3, 4, 5]
y = [2, 4, 6, 8, 10]

fig, ax = plt.subplots()

# 設定 X 軸標籤,並將 fontsize 設為 None
ax.set_xlabel('X Label', fontsize=None)

# 設定 Y 軸標籤,並將 fontsize 設為 None
ax.set_ylabel('Y Label', fontsize=None)

# 設定刻度標籤的 fontsize,並將 fontsize 設為 None
ax.tick_params(axis='both', labelsize=None)

# 繪製線條
ax.plot(x, y)

# 顯示圖形
plt.show()
ax.tick_params ( axis=’both’, labelsize=None)
#tick_params結尾有加s,
#axis=”both”,非 which=”both”
which and axis are not the same parameter.
which specifies which type of ticks to apply the tick parameters to, i.e., ‘major’, ‘minor’, or ‘both’.
axis specifies the axis to apply the tick parameters to, i.e., ‘x’, ‘y’, or ‘both’.
So ax.tick_params(which=”both”, labelsize=fontsz) sets the tick parameters (in this case, labelsize) for both major and minor ticks on both the x and y axes.
本例因為沒有minor tick,
所以axis, which這兩個參數看起來一樣
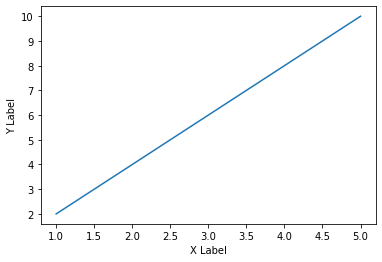
輸出結果:
推薦hahow線上學習python: https://igrape.net/30afN
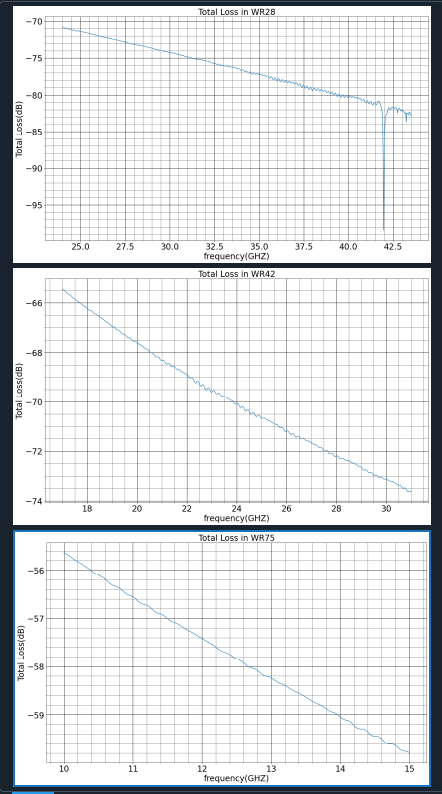
lisTotLoss: List[pd.Series] #len=3
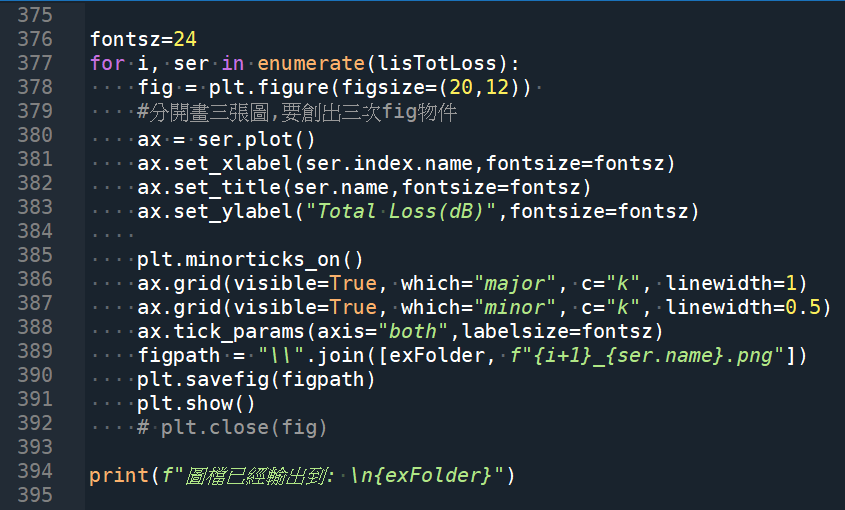
輸出結果:
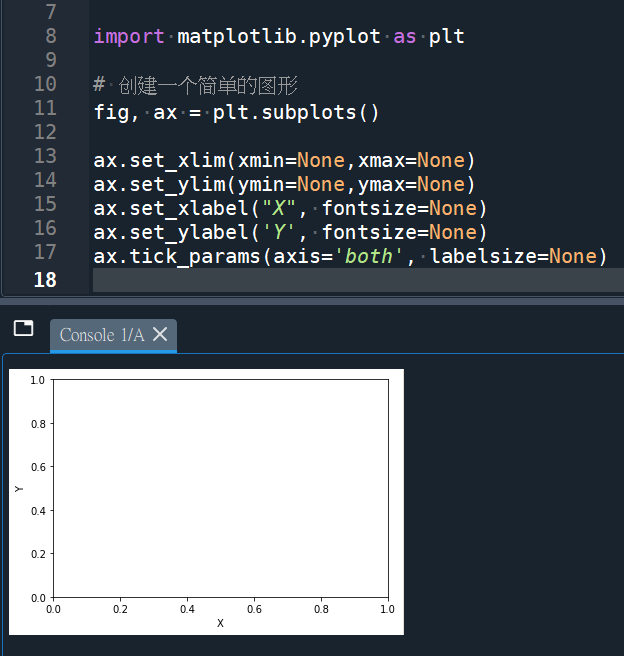
ax.set_xlim(xmin=None, xmax=None)
#很多參數可以設None (matplotlib自動)
#如: xmin xmax ymin ymax fontsize labelsize
推薦hahow線上學習python: https://igrape.net/30afN


![Python: 如何判斷字符串內容是否為數字(整數或浮點數)? isinstance( eval( entry.get() ), (float, int) ) ; str.isdigit() #不包括小數點和負號 ; try~ except ValueError~ ; 正則表示法 regular expression ; pattern = ‘^[-+]?[0-9]*\.?[0-9]+([eE][-+]?[0-9]+)?$’](https://i2.wp.com/savingking.com.tw/wp-content/uploads/2023/05/20230512152430_3.png?quality=90&zoom=2&ssl=1&resize=350%2C233 "Python: 如何判斷字符串內容是否為數字(整數或浮點數)? isinstance( eval( entry.get() ), (float, int) ) ; str.isdigit() #不包括小數點和負號 ; try~ except ValueError~ ; 正則表示法 regular expression ; pattern = ‘^[-+]?[0-9]*\.?[0-9]+([eE][-+]?[0-9]+)?$’")


![Python: 如何將folder_name, file_name合併為file_path? fpath = os.path .join(folder, fname) ; "\".join([folder, fname]) ; 如何將file_path拆分出folder? - 儲蓄保險王](https://savingking.com.tw/wp-content/uploads/2023/03/20230330132954_84-509x245.png)

近期留言