import matplotlib.pyplot as plt
x = [1, 2, 3, 4, 5]
y = [2, 4, 6, 8, 10]
fig, ax = plt.subplots()
# 設定 X 軸標籤,並將 fontsize 設為 None
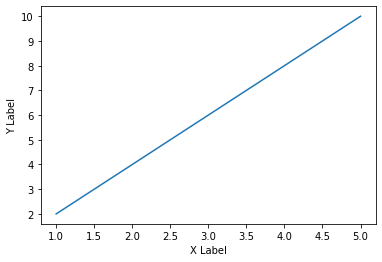
ax.set_xlabel('X Label', fontsize=None)
# 設定 Y 軸標籤,並將 fontsize 設為 None
ax.set_ylabel('Y Label', fontsize=None)
# 設定刻度標籤的 fontsize,並將 fontsize 設為 None
ax.tick_params(axis='both', labelsize=None)
# 繪製線條
ax.plot(x, y)
# 顯示圖形
plt.show()
ax.tick_params ( axis=’both’, labelsize=None)
#tick_params結尾有加s,
#axis=”both”,非 which=”both”
which and axis are not the same parameter.
which specifies which type of ticks to apply the tick parameters to, i.e., ‘major’, ‘minor’, or ‘both’.
axis specifies the axis to apply the tick parameters to, i.e., ‘x’, ‘y’, or ‘both’.
So ax.tick_params(which=”both”, labelsize=fontsz) sets the tick parameters (in this case, labelsize) for both major and minor ticks on both the x and y axes.
本例因為沒有minor tick,
所以axis, which這兩個參數看起來一樣
輸出結果:
推薦hahow線上學習python: https://igrape.net/30afN
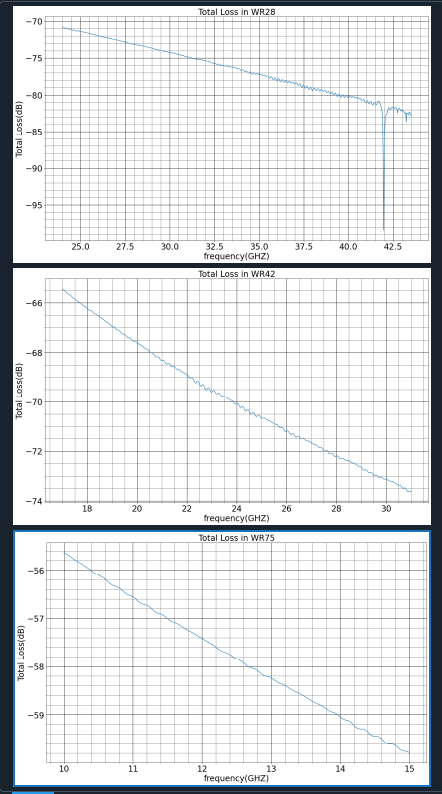
lisTotLoss: List[pd.Series] #len=3
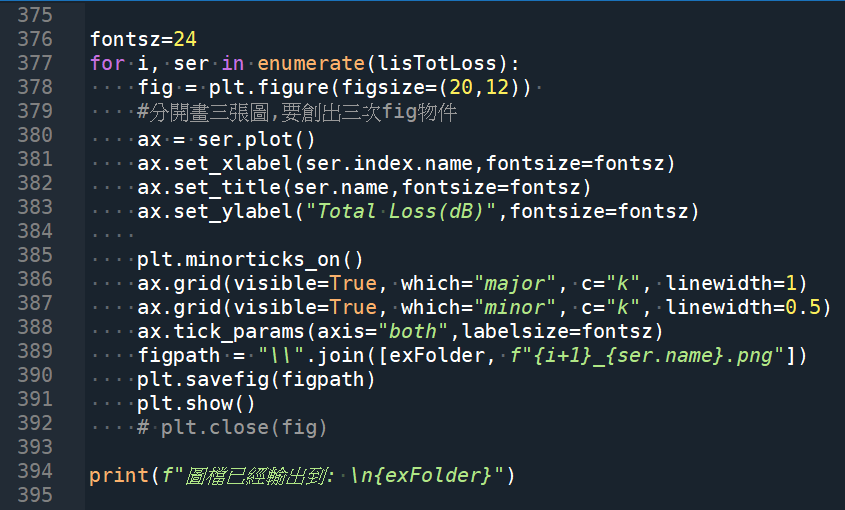
輸出結果:
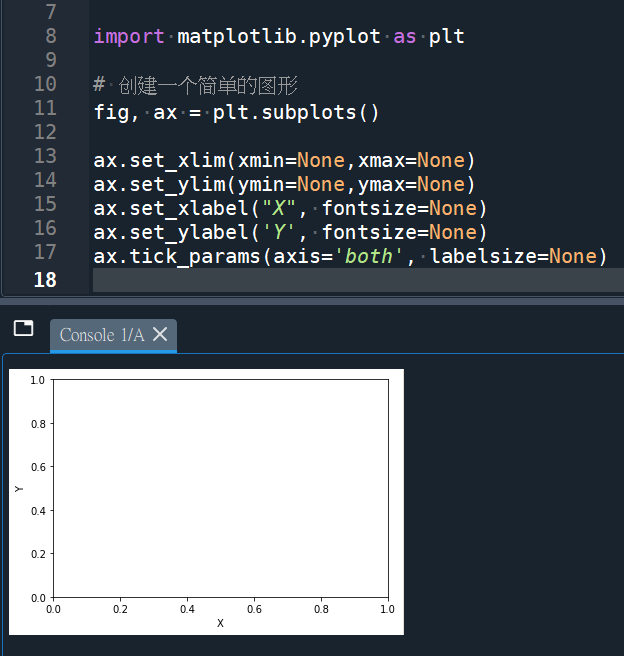
ax.set_xlim(xmin=None, xmax=None)
#很多參數可以設None (matplotlib自動)
#如: xmin xmax ymin ymax fontsize labelsize
推薦hahow線上學習python: https://igrape.net/30afN

![Python: 如何在pandas.read_csv() or pandas.read_excel() 中使用keep_default_na =False , na_values =[] 保留文件中的原始“NA”?](https://i1.wp.com/savingking.com.tw/wp-content/uploads/2024/05/20240530215737_0.png?quality=90&zoom=2&ssl=1&resize=350%2C233 "Python: 如何在pandas.read_csv() or pandas.read_excel() 中使用keep_default_na =False , na_values =[] 保留文件中的原始“NA”?")

 ; axis參數如何用? numpy.max() ; numpy.min() ; numpy.argmax() #沿軸max的index; numpy.argmin() #沿軸min的index")
 和 add_paragraph() 都創建段落,有何差別?")


from openai import AsyncAzureOpenAI")
![一文搞懂Python pandas.DataFrame去重:df.drop_duplicates() 與 df[~df.duplicated()] 的等價、差異與最佳實踐](https://i1.wp.com/savingking.com.tw/wp-content/uploads/2025/08/20250808202701_0_66f9bc.png?quality=90&zoom=2&ssl=1&resize=350%2C233 "一文搞懂Python pandas.DataFrame去重:df.drop_duplicates() 與 df[~df.duplicated()] 的等價、差異與最佳實踐")

近期留言