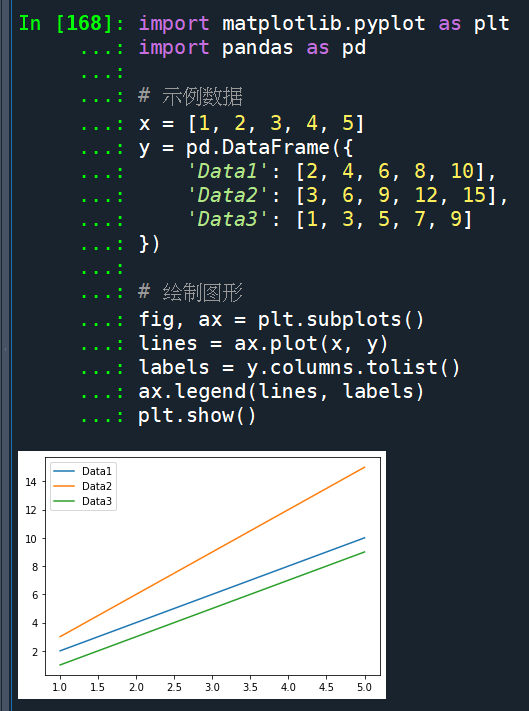
import matplotlib.pyplot as plt
import pandas as pd
# 示例数据
x = [1, 2, 3, 4, 5]
y = pd.DataFrame({
'Data1': [2, 4, 6, 8, 10],
'Data2': [3, 6, 9, 12, 15],
'Data3': [1, 3, 5, 7, 9]
})
# 绘制图形
fig, ax = plt.subplots()
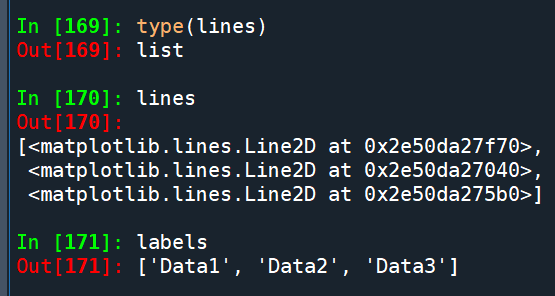
lines = ax.plot(x, y)
labels = y.columns.tolist()
ax.legend(lines, labels)
plt.show()輸出結果:
lines = ax.plot(x, y)
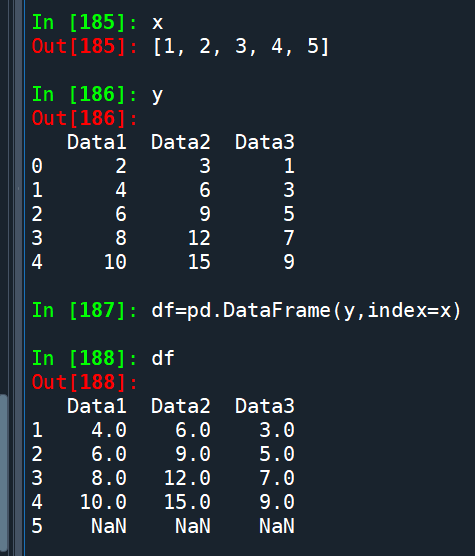
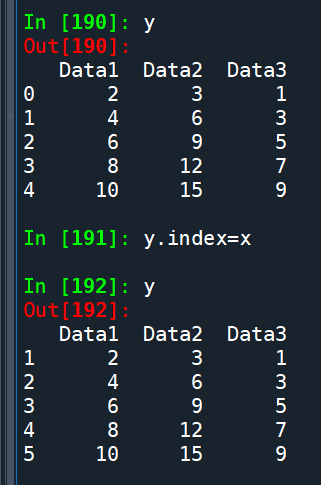
df = pd.DataFrame(y, index=x)
y的原index= 0~4
要改為x (1~5)
沒有完全match
原本index = 0的那一row被刪除了
多了index = 5的那一row,內容為NaN
ax=df.plot()
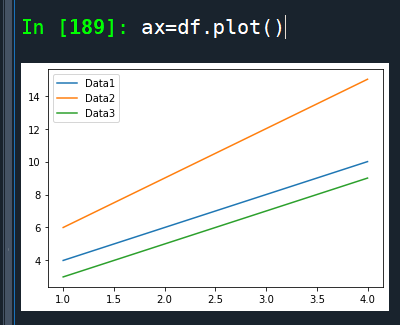
自動加上欄標籤當legend
y.index=x
這方法才不會刪除
index不match的row 資料
推薦hahow線上學習python: https://igrape.net/30afN

 教學:sys._getframe(1) vs inspect.currentframe().f_back # inspect.currentframe() 先拿到自己,再 .f_back 到 caller;等價於 sys._getframe(1)")


與副本(Copy) : 避免資料操作錯誤的指南; 如何處理SettingWithCopyWarning ?")
 ; str1 = r.recognize_google( audio, language = “zh-TW”)")
![Python: pandas.DataFrame如何移除所有空白列?pandas.isna( df_raw[0] ).tolist() ; df_drop0 = df_raw.drop(nanIdx,axis=0).reset_index(drop=True)](https://i1.wp.com/savingking.com.tw/wp-content/uploads/2022/12/20221206184635_4.png?quality=90&zoom=2&ssl=1&resize=350%2C233 "Python: pandas.DataFrame如何移除所有空白列?pandas.isna( df_raw[0] ).tolist() ; df_drop0 = df_raw.drop(nanIdx,axis=0).reset_index(drop=True)")


近期留言