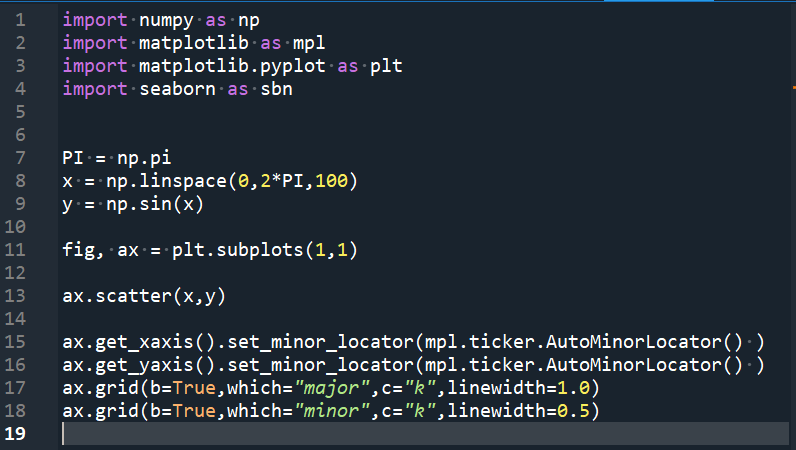
import numpy as np
import matplotlib as mpl
import matplotlib.pyplot as plt
import seaborn as sbn
PI = np.pi
x = np.linspace(0,2*PI,100)
y = np.sin(x)
fig, ax = plt.subplots(1,1) #subplots()可以參考這裡
#這行可改為: ax=plt.axes()
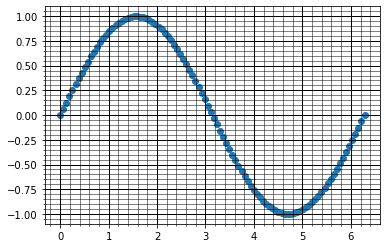
ax.scatter(x,y)
ax.get_xaxis().set_minor_locator(mpl.ticker.AutoMinorLocator() )
ax.get_yaxis().set_minor_locator(mpl.ticker.AutoMinorLocator() )
ax.grid(b=True,which=”major”,c=”k”,linewidth=1.0)
ax.grid(b=True,which=”minor”,c=”k”,linewidth=0.5)
VS code不能省略最後一行:
plt.show() 或
fig.show()
使用Spyder,
省略最後一行的.show()
仍可以正常輸出結果:
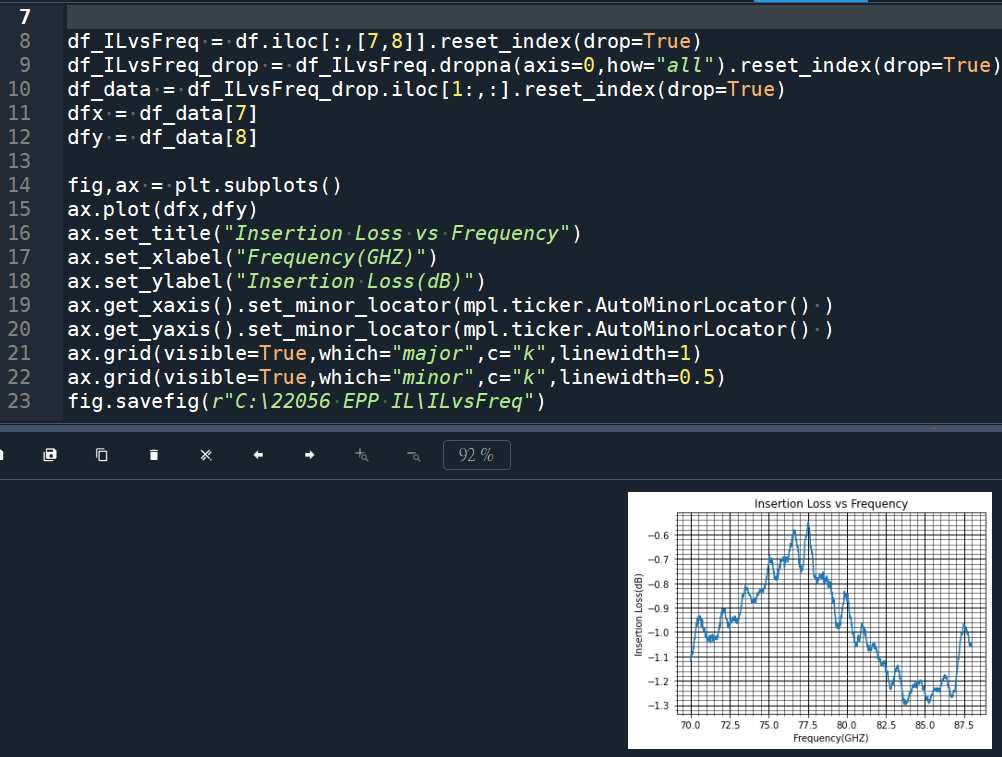
import pandas as pd
import matplotlib.pyplot as plt
import matplotlib as mpl
fpath = r”C:\22056 EPP IL\IL.xlsx”
df = pd.read_excel(fpath,header=None)
df_ILvsFreq = df.iloc[:,[7,8]].reset_index(drop=True)
df_ILvsFreq_drop = df_ILvsFreq.dropna(axis=0,how=”all”).reset_index(drop=True)
df_data = df_ILvsFreq_drop.iloc[1:,:].reset_index(drop=True)
dfx = df_data[7]
dfy = df_data[8]
fig,ax = plt.subplots()
ax.plot(dfx,dfy) #x,y放Series也可以畫
ax.set_title(“Insertion Loss vs Frequency”)
ax.set_xlabel(“Frequency(GHZ)”)
ax.set_ylabel(“Insertion Loss(dB)”)
ax.get_xaxis().set_minor_locator(mpl.ticker.AutoMinorLocator() )
ax.get_yaxis().set_minor_locator(mpl.ticker.AutoMinorLocator() )
ax.grid(visible=True,which=”major”,c=”k”,linewidth=1)
ax.grid(visible=True,which=”minor”,c=”k”,linewidth=0.5)
fig.savefig(r”C:\22056 EPP IL\ILvsFreq”)
# ax.get_xaxis().set_minor_locator(mpl.ticker.AutoMinorLocator() )
# ax.get_yaxis().set_minor_locator(mpl.ticker.AutoMinorLocator() )
這兩行程式碼很長
有無替代方式?
plt.minorticks_on()
#ax.minorticks_on() #也可

推薦hahow線上學習python: https://igrape.net/30afN

,==是邏輯判斷式,=是指定")
) ; reduce( lambda acc, x: acc + x, map(lambda x: x * 2, filter(lambda x: x % 2 == 0, numbers)))")
![Python如何讀取*.jsonl (JSON Lines)? 讀取為List[dict]](https://i1.wp.com/savingking.com.tw/wp-content/uploads/2023/10/20231024225613_30.png?quality=90&zoom=2&ssl=1&resize=350%2C233 "Python如何讀取*.jsonl (JSON Lines)? 讀取為List[dict]")


![Python:如何將folder_path & file_name合併為file_path? fpath = os.path.join (folder , fname) #不需要[ ]包覆folder,fname; fpath1 = “\\”.join( [folder , fname] ) #需要[ ] 包覆folder,fname ; 反過來講,file_path如何拆分為folder_path & file_name? os.path.dirname() ; os.path.basename() ; file_name如何拆分為主檔名與副檔名os.path.splitext() #split(分裂) ext](https://i1.wp.com/savingking.com.tw/wp-content/uploads/2023/07/20230717184401_87.png?quality=90&zoom=2&ssl=1&resize=350%2C233 "Python:如何將folder_path & file_name合併為file_path? fpath = os.path.join (folder , fname) #不需要[ ]包覆folder,fname; fpath1 = “\\”.join( [folder , fname] ) #需要[ ] 包覆folder,fname ; 反過來講,file_path如何拆分為folder_path & file_name? os.path.dirname() ; os.path.basename() ; file_name如何拆分為主檔名與副檔名os.path.splitext() #split(分裂) ext")
 切割資料(波士頓地區房價)為訓練資料跟測試資料; from sklearn.model_selection import train_test_split ; xtrain, xtest, ytrain, ytest = train_test_split(x, y, test_size=0.3, random_state=42, shuffle=True)")
")
![Python TQC 510 費氏數列,list[], f.append(n3) - 儲蓄保險王](https://savingking.com.tw/wp-content/uploads/2022/04/20220522152013_66-520x245.jpg)


近期留言