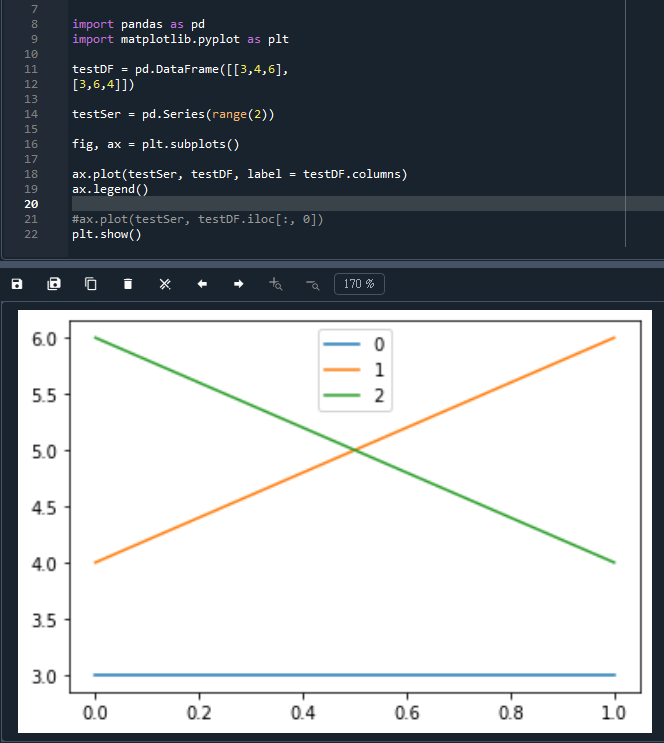
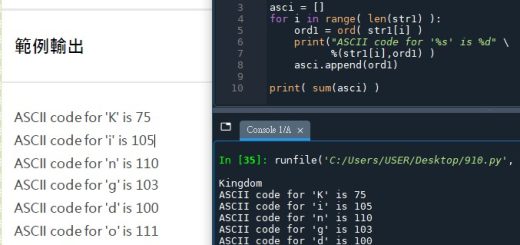
import pandas as pd
import matplotlib.pyplot as plt
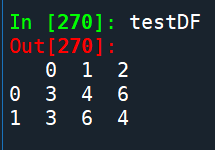
testDF = pd.DataFrame([[3,4,6],
[3,6,4]])
testSer = pd.Series(range(2))
fig, ax = plt.subplots()
ax.plot(testSer, testDF)
#ax.plot(testSer, testDF.iloc[:, 0])
plt.show()
testDF有三欄:
code:

增加label參數,以便增加legend()
(就算沒設定label參數,
也會自動抓欄標籤當label)
y可以放2D array
若兩者都是2D array,形狀必須相同
如果只有其中一個是2D array
則另外一個長度(列數)必須相同
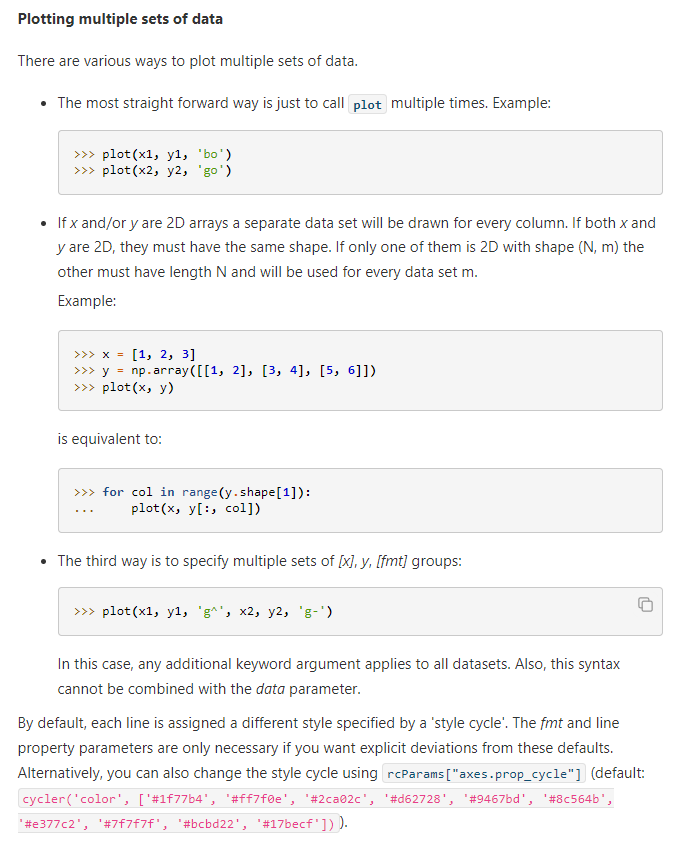
2D array不像DF有.columns 屬性可以賦值給label的話
ax.plot(x, y, label=range(y.shape[1]))

subplots() 方法返回的是
一个 Figure 对象和一个 Axes 对象数组,
如果只需要画一张图的话,
可以直接使用 add_subplot() 方法
来创建单个 Axes 对象,
这个方法返回的是一个单独的 Axes 对象。
因此,如果只需要画一张图的话,
可以使用 subplot() 替代 subplots(),例如:
import matplotlib.pyplot as plt
fig, ax = plt.subplots()
# 替代成
fig = plt.figure()
ax = fig.add_subplot(1, 1, 1)
其中 1, 1, 1 表示创建一个 1 行 1 列的图表,
并且使用第一个子图(即唯一的子图)。
import pandas as pd
import matplotlib.pyplot as plt
df = pd.DataFrame({
'A': [1, 2, 3],
'B': [3, 2, 1],
'C': [2, 3, 1]
})
ax = df.plot()
#沒有指定label
ax.legend()
#自動使用columns name當label
plt.show()

ax.set_xlabel()
ax.grid()
ax.tick_params()
都跟一般fig, ax = plt.subplot() 的方法一樣
也能指定figsize
用plt.savefig() 存檔

使用ax=DF.plot() 繪圖,
不需要自己import matplotlib.pyplot, 自動import,
但如果想進一步調整圖形的細節,
可能需要使用matplotlib.pyplot中的其他函数。
不需要for迴圈,自動畫所有columns vs index,
不需要設定label, ax.legend()自動使用欄標籤當label
推薦hahow線上學習python: https://igrape.net/30afN
, list(n)*m #有m個元素n, ndarray.tolist()可以將array轉為list")

![Python: 字串 str.find(關鍵字[,start][,end]),找不到的話回傳-1,如何找出資料字串中,所有關鍵字的index?詞頻計算](https://i2.wp.com/savingking.com.tw/wp-content/uploads/2022/11/20221122100657_32.png?quality=90&zoom=2&ssl=1&resize=350%2C233 "Python: 字串 str.find(關鍵字[,start][,end]),找不到的話回傳-1,如何找出資料字串中,所有關鍵字的index?詞頻計算")

 ; 如何將資料夾中的多個csv檔求平均?")
 ; OrderedDict.fromkeys()")

 as z: print(z.namelist()) ; z.infolist()")

![Python: list.index() 只能找到第一個元素的index,若元素有重複,如何找出所有index? indexes = [index for index, value in enumerate(my_list) if value == target] - 儲蓄保險王](https://savingking.com.tw/wp-content/uploads/2024/10/20241010101216_0_12b6c0-520x245.png)

近期留言