參考資料:
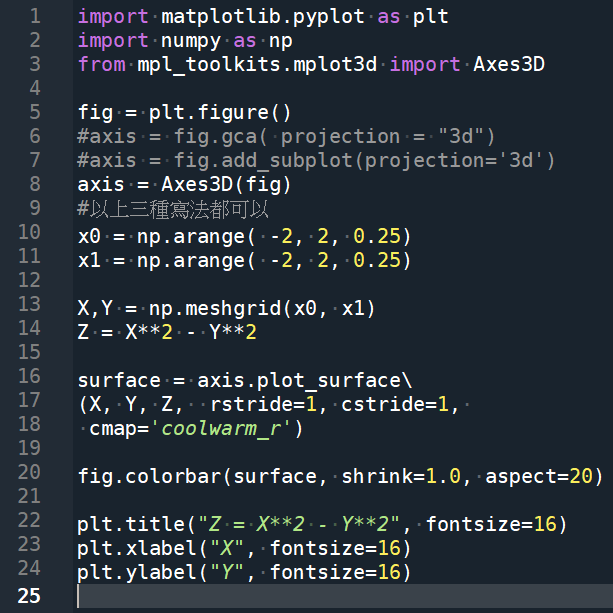
import matplotlib.pyplot as plt
import numpy as np
from mpl_toolkits.mplot3d import Axes3D
fig = plt.figure()
#axis = fig.gca( projection = “3d”)
#axis = fig.add_subplot(projection=’3d’)
axis = Axes3D(fig)
#以上三種axis寫法都可以
“””
- 若使用 plt.method,其實就是在呼叫當前的 axes(不是axis) 進行畫圖
- matplotlib.pyplot.gcf()
- 得到當前的 figure
- matplotlib.pyplot.gca()
- 得到當前的 axes
- matplotlib.pyplot.sca(ax)
- 設定當前的 axes,並且會自動更正 figure
- matplotlib.pyplot.gcf()
.gca()中放參數已被棄用:
MatplotlibDeprecationWarning: Calling gca() with keyword arguments was deprecated(棄用) in Matplotlib 3.4. Starting two minor releases later, gca() will take no keyword arguments. The gca() function should only be used to get the current axes, or if no axes exist, create new axes with default keyword arguments. To create a new axes with non-default argumentms, use plt.axes() or plt.subplot().
ax = fig.gca (projection = “3d”)
matplotlib.__version__
‘3.5.3’
Axes3D(fig)前面則要先
from mpl_toolkits.mplot3d import Axes3D
三種中最建議使用 :
axis = fig.add_subplot(projection=’3d’)
官網建議:
axis = plt.axes(projection=”3d”)
axis = plt.subplot(projection=”3d”)
“””
x0 = np.arange( -2, 2, 0.25)
x1 = np.arange( -2, 2, 0.25)
X,Y = np.meshgrid(x0, x1)
Z = X**2 – Y**2
surface = axis.plot_surface\
(X, Y, Z, rstride=1, cstride=1,
cmap=’coolwarm_r’)
fig.colorbar(surface, shrink=1.0, aspect=20)
plt.title(“Z = X**2 – Y**2”, fontsize=16)
plt.xlabel(“X”, fontsize=16)
plt.ylabel(“Y”, fontsize=16)
函式使用介紹:
- plot_surface(X, Y, Z, *args, **kwargs)
- X,Y,Z:分別是三個代表X,Y,Z座標的2D array
- cstride, rstride:分別對應column與row方向的降採樣步伐,也就是繪圖的時候多少格要畫在同個網格內
- cmap:Colormap,輸入一個字串對應一個3D surface的顏色
- colorbar(mappable, **kwargs)
- mappable:colorbar要加入的圖
- shrink:控制colorbar的高度(預設為1.0)
- aspect:控制colorbar的寬高比(預設為20)
輸出結果:

推薦hahow線上學習python: https://igrape.net/30afN
=====再練習一次不同範例=====
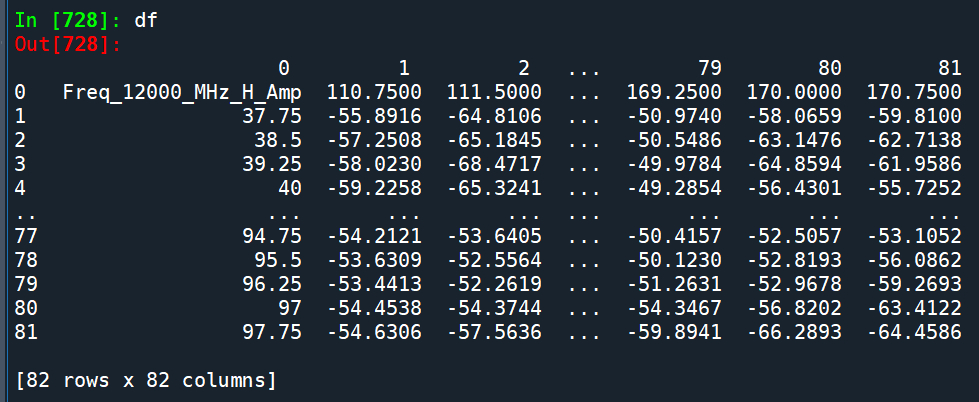
從csv檔讀進來的DataFrame:
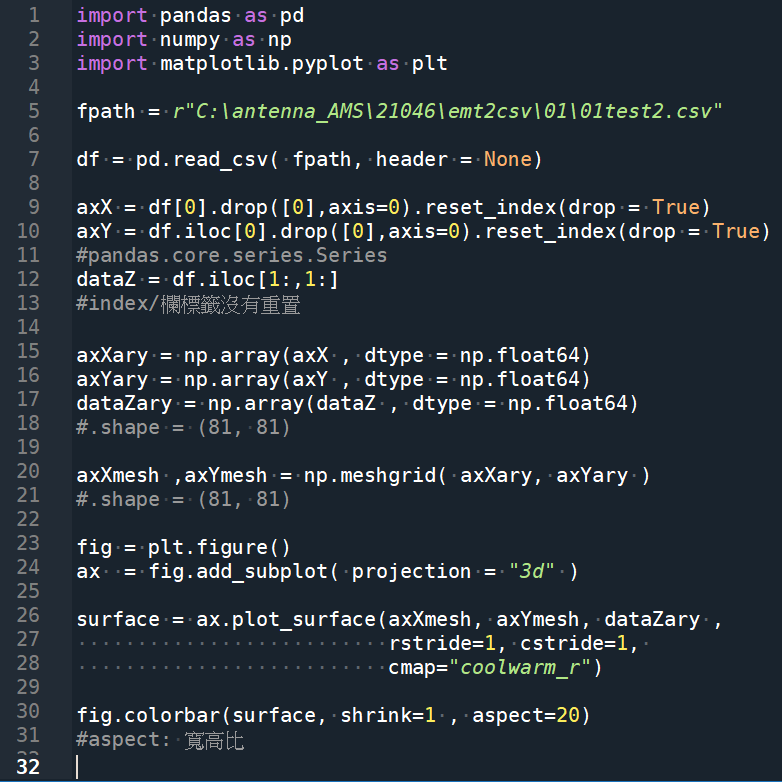
import pandas as pd
import numpy as np
import matplotlib.pyplot as plt
fpath = r”C:\antenna_AMS\21046\emt2csv\01\01test2.csv”
df = pd.read_csv( fpath, header = None)
axX = df[0].drop([0],axis=0).reset_index(drop = True)
axY = df.iloc[0].drop([0],axis=0).reset_index(drop = True)
#pandas.core.series.Series
dataZ = df.iloc[1:,1:]
#index/欄標籤沒有重置
axXary = np.array(axX , dtype = np.float64)
axYary = np.array(axY , dtype = np.float64)
dataZary = np.array(dataZ , dtype = np.float64)
#.shape = (81, 81)
axXmesh ,axYmesh = np.meshgrid( axXary, axYary )
#.shape = (81, 81)
fig = plt.figure()
ax = fig.add_subplot( projection = “3d” )
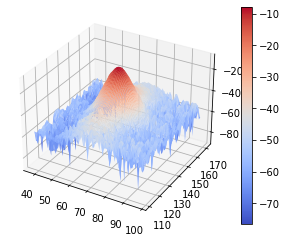
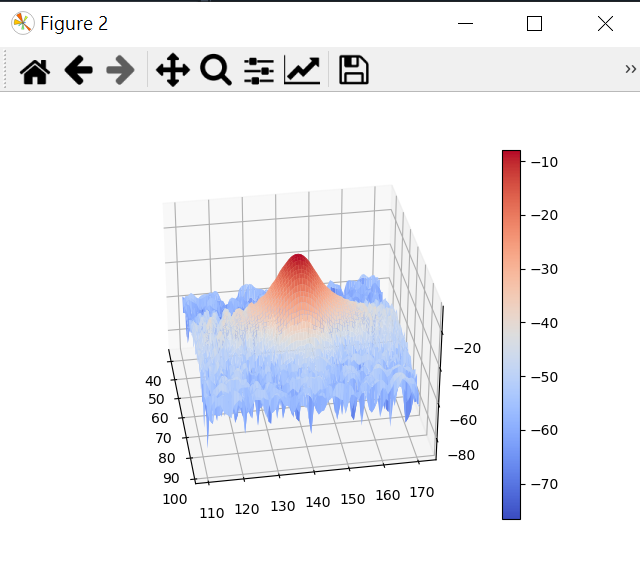
surface = ax.plot_surface(axXmesh, axYmesh, dataZary ,
rstride=1, cstride=1,
cmap=”coolwarm_r”)
fig.colorbar(surface, shrink=1 , aspect=20)
#aspect: 寬高比
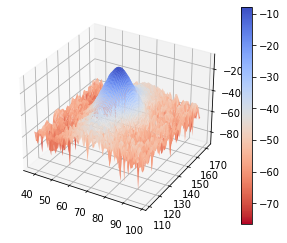
輸出的圖片:
surface = ax.plot_surface(axXmesh, axYmesh, dataZary ,
rstride=1, cstride=1,
cmap=”coolwarm“)
#coolwarm_r改為coolwarm
surface = ax.plot_surface(axXmesh, axYmesh, dataZary ,
rstride=1, cstride=1,
cmap=”coolwarm_r”)
fig.colorbar(surface, shrink=1 , aspect=20)
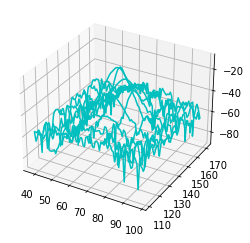
上面這段替換為以下(只要線框)
ax.plot_wireframe(axXmesh, axYmesh, dataZary ,
cstride=10, rstride=10,color=’c’)
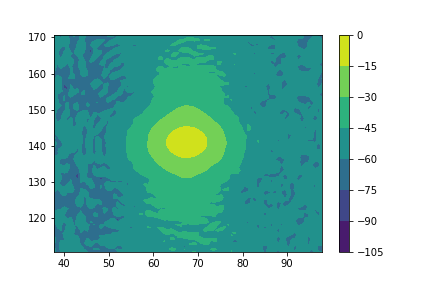
替換為以下:
ax = plt.subplot() #去掉參數projection = “3d”
cp = ax.contourf(axXmesh, axYmesh, dataZary) #等高線圖
fig.colorbar(cp) # 给图像添加颜色柱
推薦hahow線上學習python: https://igrape.net/30afN
一樣的code, 最末加一行plt.show()
改用VS code (spyder可以省略這一行程式碼)
即可用滑鼠改變3D圖的視角
要用spyder處理的話
console中輸入
%matplotlib qt
#interactive plotting in separate window
再執行py程式
就會有獨立視窗跑出來:
#normal charts inside notebooks
%matplotlib inline
切換回原本的內嵌模式
推薦hahow線上學習python: https://igrape.net/30afN

![Python陣列介紹:List[ ], Tuple( ), Set{ }, Dictionary{ }, for迴圈](https://i1.wp.com/savingking.com.tw/wp-content/uploads/2022/01/1643329597-856443d20256b1a850089a56d07657bf.png?quality=90&zoom=2&ssl=1&resize=350%2C233 "Python陣列介紹:List[ ], Tuple( ), Set{ }, Dictionary{ }, for迴圈")


.f_code.co_name #動態取得function_name")
 法則")
; self.radius=1")
,計算元大人壽美滿人生(F1) IRR,免費下載IRR計算機")


![Python: 如何用numpy.ndarray的reshape 將3D array轉為2D array,再轉為pandas.DataFrame? arr.reshape( arr.shape[0] * arr.shape[1] , -1) - 儲蓄保險王](https://savingking.com.tw/wp-content/uploads/2023/03/20230320082325_85-297x245.png)

近期留言