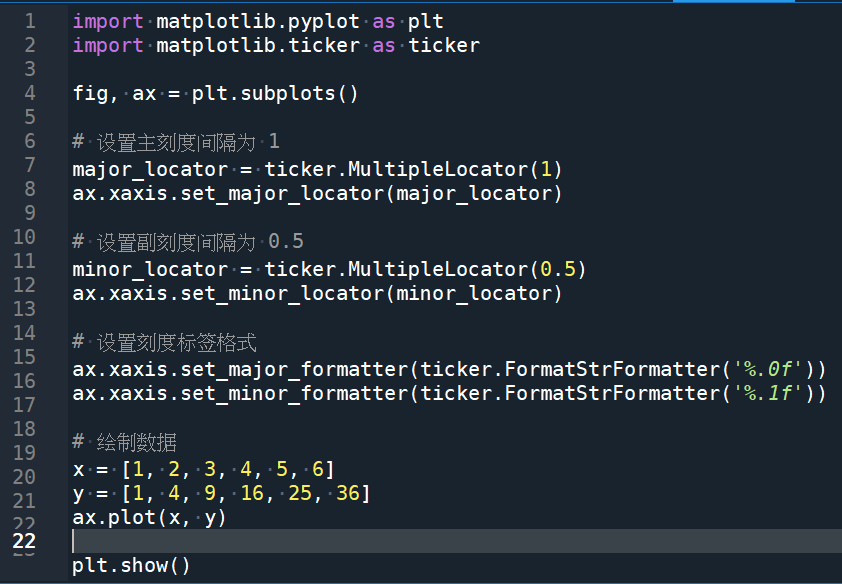
import matplotlib.pyplot as plt
import matplotlib.ticker as ticker
fig, ax = plt.subplots()
# 设置主刻度间隔为 1
major_locator = ticker.MultipleLocator(1)
ax.xaxis.set_major_locator(major_locator)
# 设置副刻度间隔为 0.5
minor_locator = ticker.MultipleLocator(0.5)
ax.xaxis.set_minor_locator(minor_locator)
# 设置刻度标签格式
ax.xaxis.set_major_formatter(ticker.FormatStrFormatter(‘%.0f’))
ax.xaxis.set_minor_formatter(ticker.FormatStrFormatter(‘%.1f’))
# 绘制数据
x = [1, 2, 3, 4, 5, 6]
y = [1, 4, 9, 16, 25, 36]
ax.plot(x, y)
plt.show()
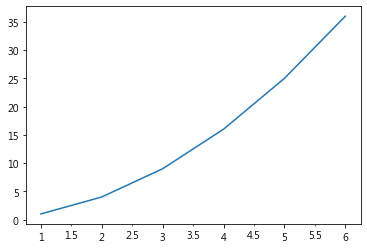
輸出結果:
推薦hahow線上學習python: https://igrape.net/30afN
 與 listC = listA + listB的差別?")
,版面配置>行號>連續")
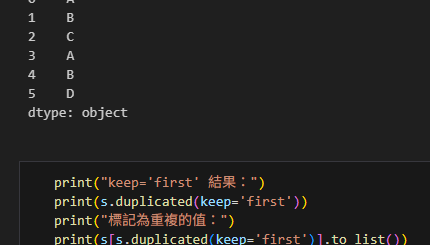
 方法說明,計算唯一值的數量,與 len( pandas.Series.unique() ) 同效果")

![Python: pandas.DataFrame如何移除所有空白列?pandas.isna( df_raw[0] ).tolist() ; df_drop0 = df_raw.drop(nanIdx,axis=0).reset_index(drop=True)](https://i1.wp.com/savingking.com.tw/wp-content/uploads/2022/12/20221206184635_4.png?quality=90&zoom=2&ssl=1&resize=350%2C233 "Python: pandas.DataFrame如何移除所有空白列?pandas.isna( df_raw[0] ).tolist() ; df_drop0 = df_raw.drop(nanIdx,axis=0).reset_index(drop=True)")

")

")


近期留言