mmw Demo Data Structure v0.1:
#ADCsamples is set in the profileCfg line of the cfg file ;
#RangeBins = number of ADC samples rounded up(向上取整) to the nearest power of 2
profile.cfg : profileCfg 0 77 372 7 114.29 0 0 35 1 240 2257 0 0 30 ;
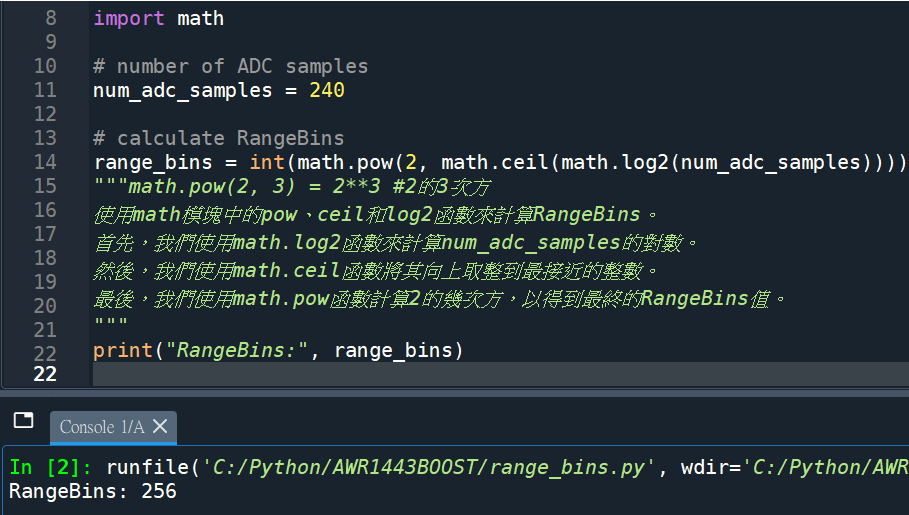
import math
# number of ADC samples
num_adc_samples = 240
# calculate RangeBins
range_bins = int(math.pow(2, math.ceil(math.log2(num_adc_samples))))
"""math.pow(2, 3) = 2**3 #2的3次方
2** math.ceil(math.log2(num_adc_samples))
#這樣也可以 #2**8=256
使用math模塊中的pow、ceil和log2函數來計算RangeBins。
首先,我們使用math.log2函數來計算num_adc_samples的對數。
然後,我們使用math.ceil函數將其向上取整到最接近的整數。
最後,我們使用math.pow函數計算2的幾次方,以得到最終的RangeBins值。
"""
print("RangeBins:", range_bins)
推薦hahow線上學習python: https://igrape.net/30afN

 ; hex() or bin() #轉為16 or 2進位數字,會省略前導0")

,類別(Class), 物件(Object), 屬性(Attribute)=變數, 方法(Method)=函式, 建構式(Constructor) def __init__(self,x,y): 計算計程車車資, assert 斷言, 全域變數與區域變數")
![別把中文洗掉:Python `isalnum()` vs `[^A-Za-z0-9]` 含/不含 CJK中日韓](https://i2.wp.com/savingking.com.tw/wp-content/uploads/2026/05/20260525082752_0_4776cd.png?quality=90&zoom=2&ssl=1&resize=350%2C233 "別把中文洗掉:Python `isalnum()` vs `[^A-Za-z0-9]` 含/不含 CJK中日韓")
 ; self.process_button.pack(fill=’both’, expand=True) ; 物件導向避免使用全域變數")
 方法處理鍵不存在的情況; apple_count = my_dict .get( ‘apple’ , 0) # 如果鍵存在,返回對應的值,否則返回預設值 0")
 教學:sys._getframe(1) vs inspect.currentframe().f_back # inspect.currentframe() 先拿到自己,再 .f_back 到 caller;等價於 sys._getframe(1)")


近期留言