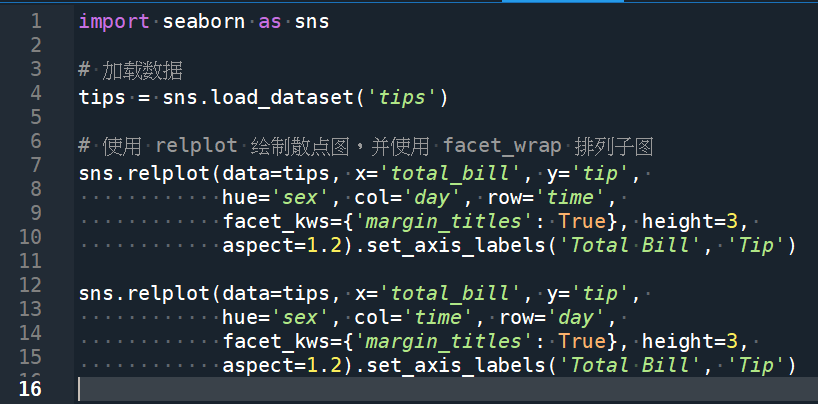
import seaborn as sns
# 加载数据
tips = sns.load_dataset(‘tips’)
# 使用 relplot 绘制散点图,并使用 facet_wrap 排列子图
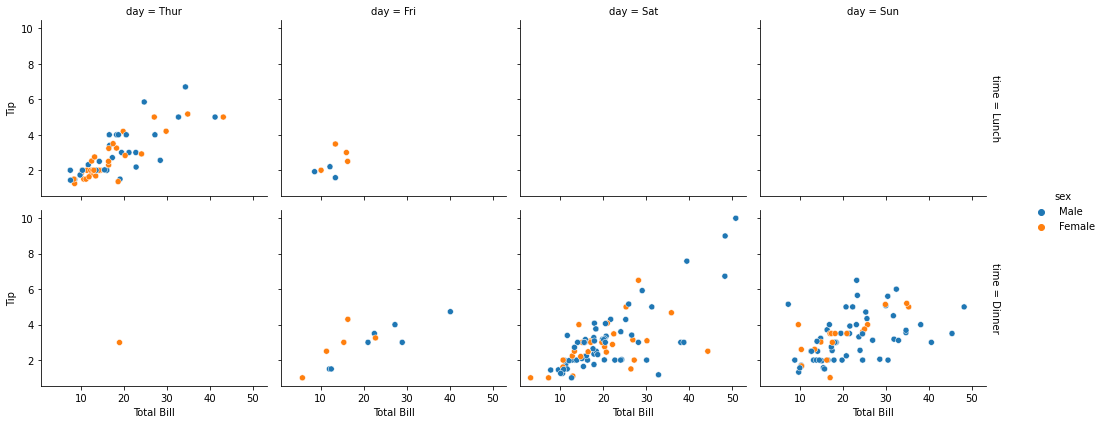
sns.relplot(data=tips, x=’total_bill’, y=’tip’,
hue=’sex’, col=’day’, row=’time’,
facet_kws={‘margin_titles’: True}, height=3,
aspect=1.2).set_axis_labels(‘Total Bill’, ‘Tip’)
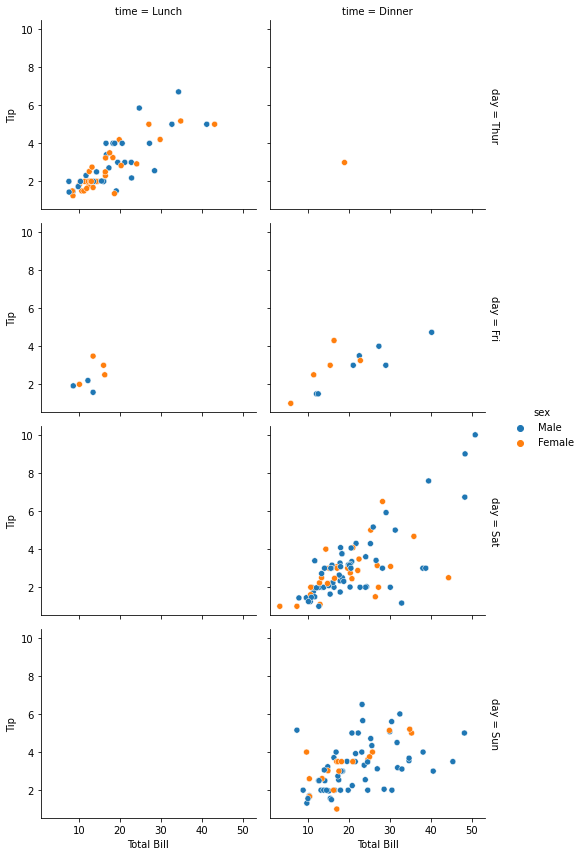
sns.relplot(data=tips, x=’total_bill’, y=’tip’,
hue=’sex’, col=’time’, row=’day’,
facet_kws={‘margin_titles’: True}, height=3,
aspect=1.2).set_axis_labels(‘Total Bill’, ‘Tip’)
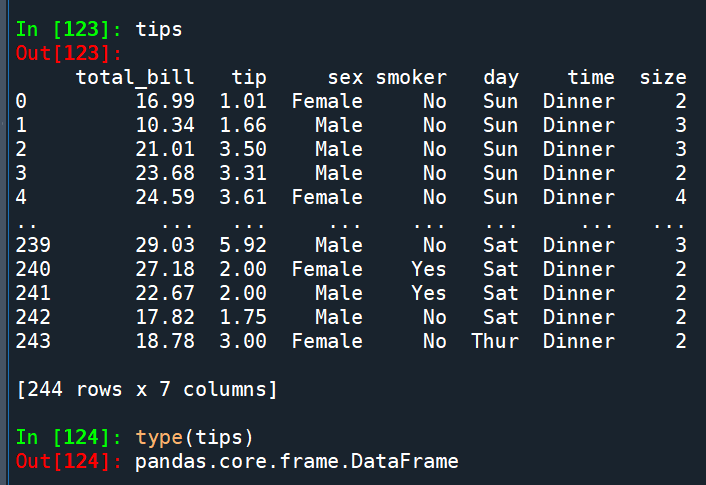
tips(pandas.core.frame.DataFrame):
col=’day’, row=’time’
col=’time’, row=’day’
推薦hahow線上學習python: https://igrape.net/30afN


; 對於np.bool_ 做乘法等效於and ; 對於np.bool_ 做加法等效於or")
; BM25 (Best Matching 25) ; pip install rank-bm25 ; from rank_bm25 import BM25Okapi")

 ; .localtime() ; .tm_year ; .tm_mon ; .tm_mday ; .ctime() #current time ; .sleep() ;time.asctime() #as string ; time.strftime() #string format time")

與滾動條(Scrollbar)? canvas = tk.Canvas(root, width=400, height=300) ; scrollbar = tk.Scrollbar(root, command = canvas.yview) ; canvas.configure( yscrollcommand = scrollbar.set)")


近期留言