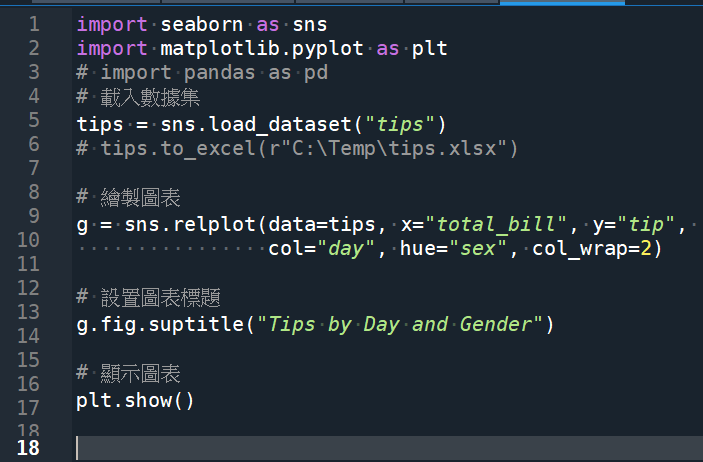
import seaborn as sns
import matplotlib.pyplot as plt
# import pandas as pd
# 載入數據集
tips = sns.load_dataset(“tips”)
# tips.to_excel(r”C:\Temp\tips.xlsx”)
# 繪製圖表
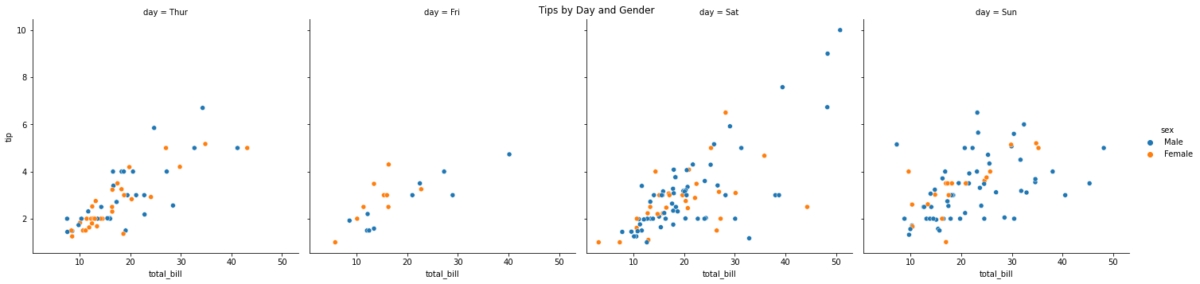
g = sns.relplot(data=tips, x=”total_bill”, y=”tip”,
col=”day”, hue=”sex”, col_wrap=2)
# 設置圖表標題
g.fig.suptitle(“Tips by Day and Gender”)
“””這行程式碼是用來設定 Seaborn 繪圖物件 g 的標題,fig 是指 Seaborn 繪圖物件的 Figure 物件,suptitle 是指設定 Figure 物件的標題。因此,這行程式碼會在圖片上方中央顯示 “Tips by Day and Gender” 的標題。”””
# 顯示圖表
plt.show()
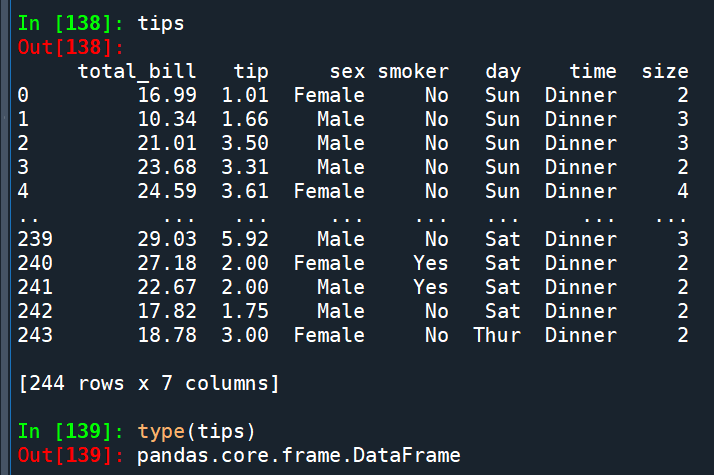
tips(DataFrame):
若將tips輸出為xlsx檔:
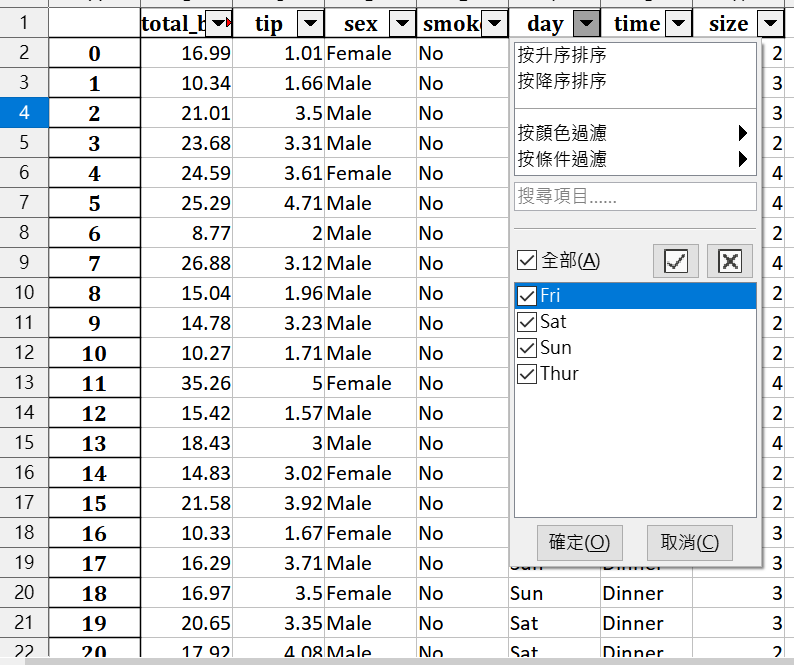
day共有四天
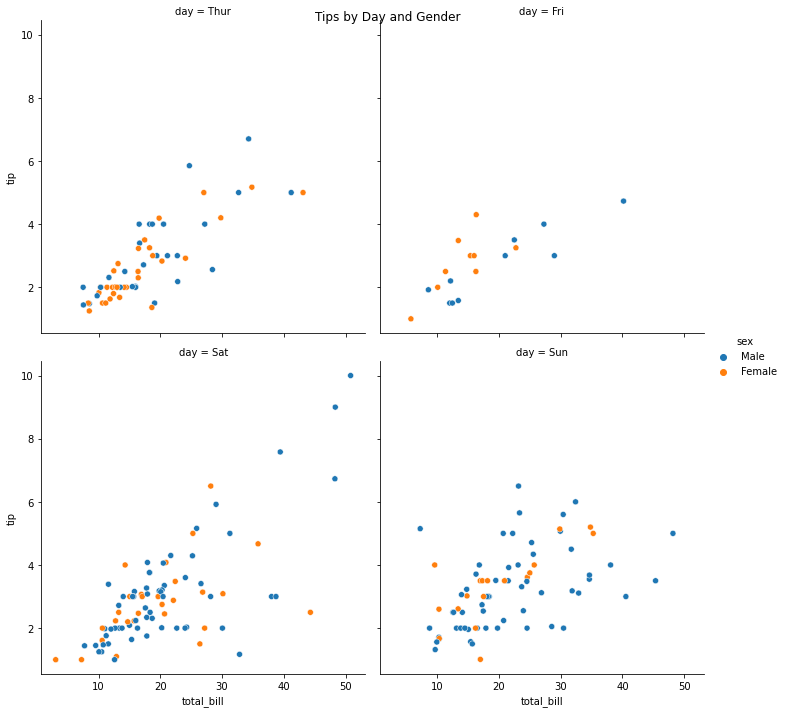
g = sns.relplot(data=tips, x=”total_bill”, y=”tip”,
col=”day”, hue=”sex”, col_wrap=2)
col_wrap=2 限制欄數最多為2
輸出的圖檔:
g = sns.relplot(data=tips, x=”total_bill”, y=”tip”,
col=”day”, hue=”sex”)
去掉col_wrap=2參數
輸出圖檔:
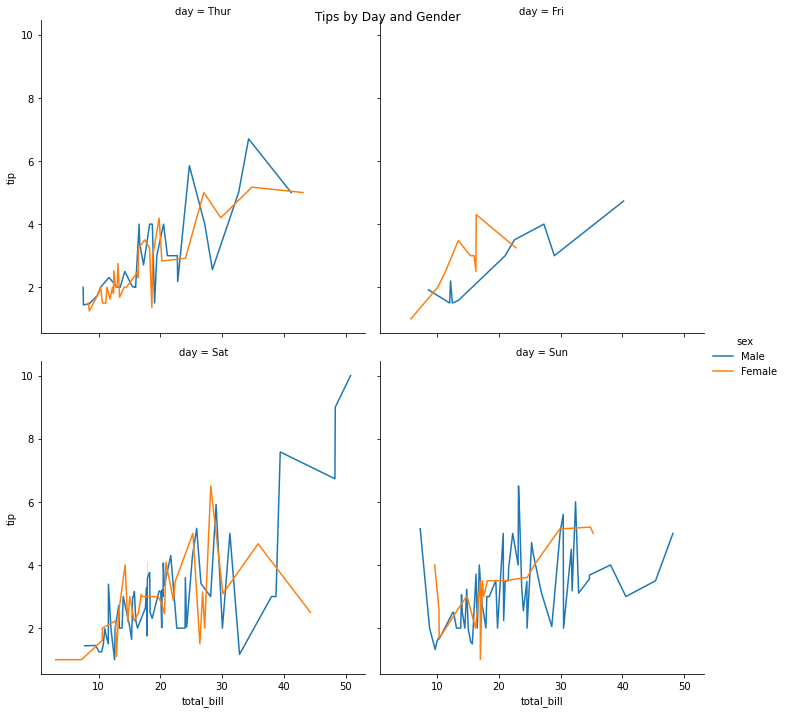
g = sns.relplot(data=tips, x=”total_bill”, y=”tip”,
col=”day”, hue=”sex”,col_wrap=2, kind=”line”)
多加參數 kind=”line”
換成折線圖
推薦hahow線上學習python: https://igrape.net/30afN

 和 add_paragraph() 都創建段落,有何差別?")
![Python: matplotlib繪圖,如何限定座標軸範圍? plt.axis([xmin, xmax, ymin, ymax])](https://i1.wp.com/savingking.com.tw/wp-content/uploads/2023/02/20230208101745_93.jpg?quality=90&zoom=2&ssl=1&resize=350%2C233 "Python: matplotlib繪圖,如何限定座標軸範圍? plt.axis([xmin, xmax, ymin, ymax])")
 ; Python的命名慣例: 全大寫表示常數,首字大寫表示Class")
![Python: 如何判斷字符串內容是否為數字(整數或浮點數)? isinstance( eval( entry.get() ), (float, int) ) ; str.isdigit() #不包括小數點和負號 ; try~ except ValueError~ ; 正則表示法 regular expression ; pattern = ‘^[-+]?[0-9]*\.?[0-9]+([eE][-+]?[0-9]+)?$’](https://i1.wp.com/savingking.com.tw/wp-content/uploads/2023/05/20230512152430_3.png?quality=90&zoom=2&ssl=1&resize=350%2C233 "Python: 如何判斷字符串內容是否為數字(整數或浮點數)? isinstance( eval( entry.get() ), (float, int) ) ; str.isdigit() #不包括小數點和負號 ; try~ except ValueError~ ; 正則表示法 regular expression ; pattern = ‘^[-+]?[0-9]*\.?[0-9]+([eE][-+]?[0-9]+)?$’")


,dtype=int) ; B = np.zeros((2,3,4),dtype=int)")

近期留言