


Figures now render in the Plots pane by default. To make them also appear inline in the Console, uncheck “Mute Inline Plotting” under the Plots pane options menu.
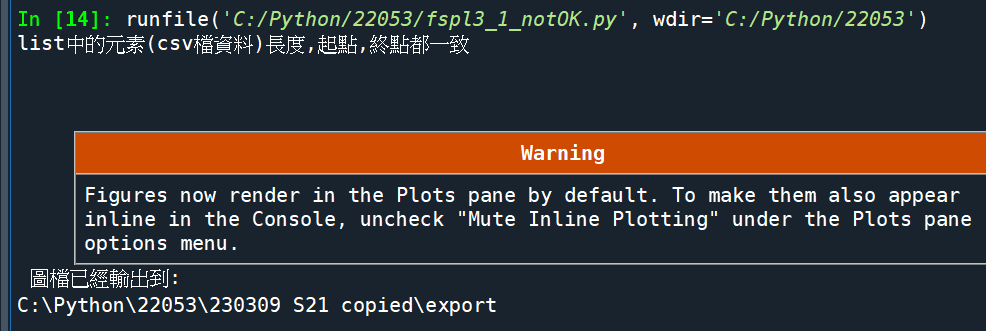
如何消除?
Plots => “Mute Inline Plotting”
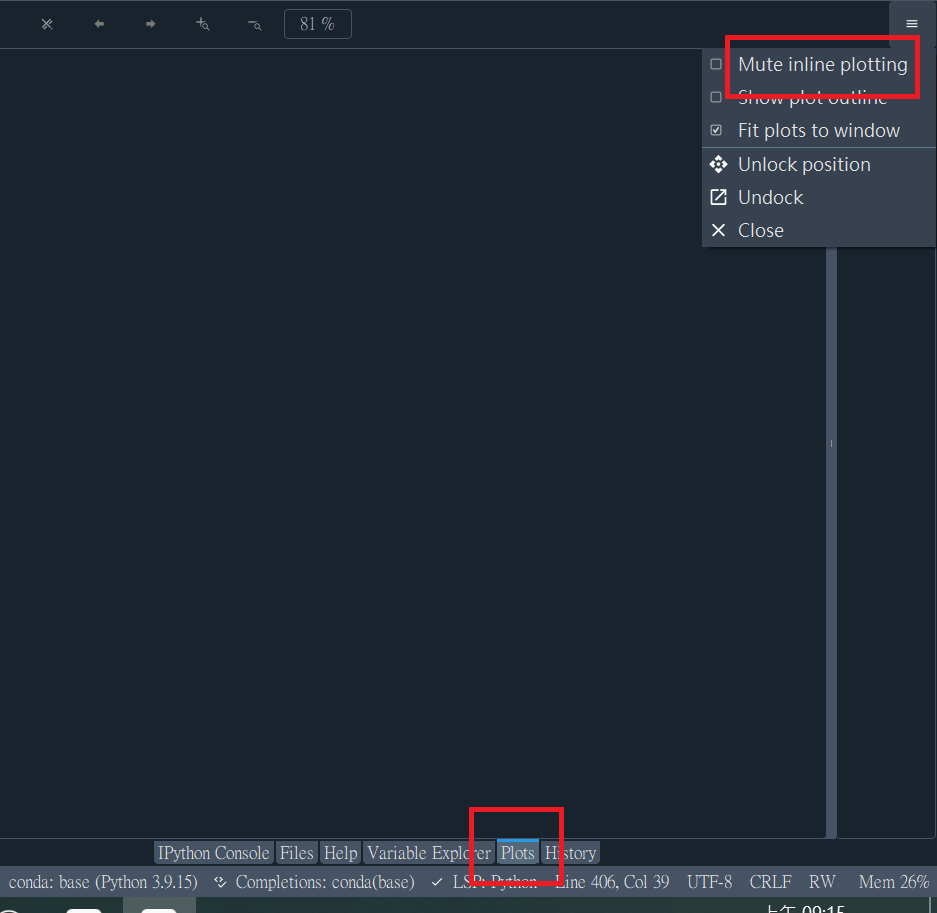
圖片將直接出現在IPython Console中
如果figsize設定比較大
也會占掉Console滿大版面
可視自己習慣是否勾選
“Mute Inline Plotting”
IPython Console中:
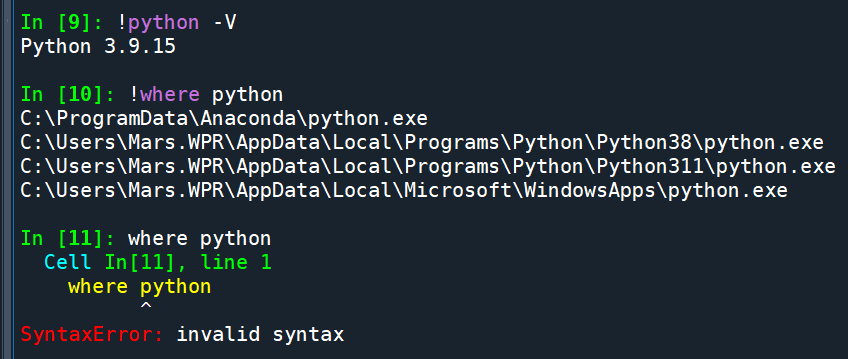
!python -V 查詢python版本
!where python 查詢python安裝路徑
前面多加一個!
效果同cmd中key一樣的指令
沒加!則會出現
SyntaxError: invalid syntax
推薦hahow線上學習python: https://igrape.net/30afN

![Python: Regular Expression 正規表示法 正則表達式 import re ; pattn = “[\d]{4}\/[01][\d]\/[0123][\d] [\d]{6}” ; match = re .search (pattn,text) .group()](https://i0.wp.com/savingking.com.tw/wp-content/uploads/2022/09/20220901154435_19.png?quality=90&zoom=2&ssl=1&resize=350%2C233 "Python: Regular Expression 正規表示法 正則表達式 import re ; pattn = “[\d]{4}\/[01][\d]\/[0123][\d] [\d]{6}” ; match = re .search (pattn,text) .group()")



近期留言