#Python TQC考題902 資料加總
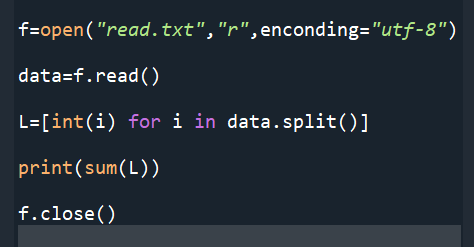
f=open(“read.txt”,”r”,enconding=”utf-8″)
data=f.read()
L=[int(i) for i in data.split()]
print(sum(L))
f.close()
“””
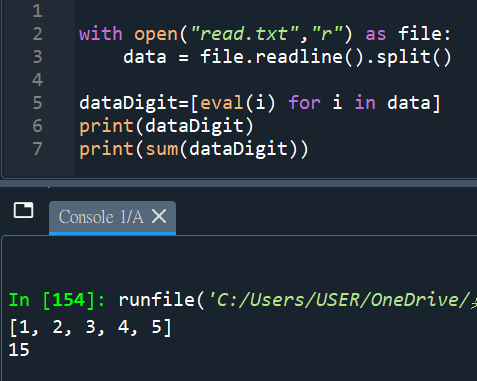
read.txt的內容:
1 2 3 6 3
(加總=15)
“””
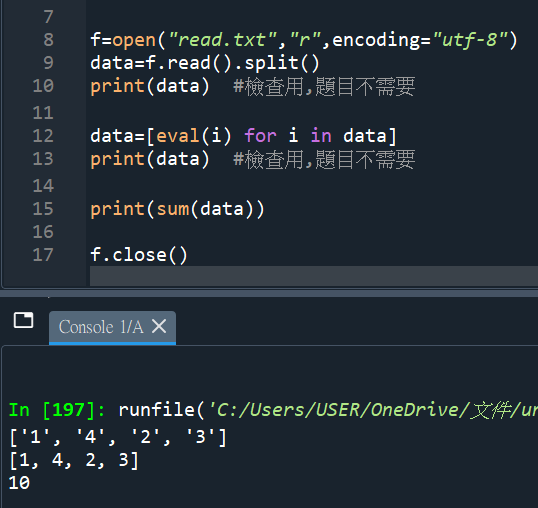
#多印一些資料,了解程式運作:
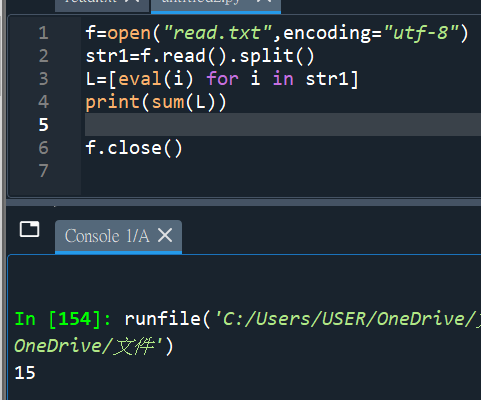
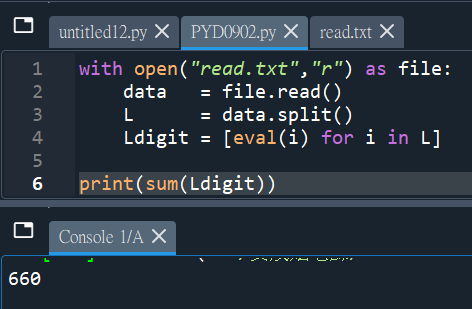
#read.txt內容: 1 4 2 3 (加總10)
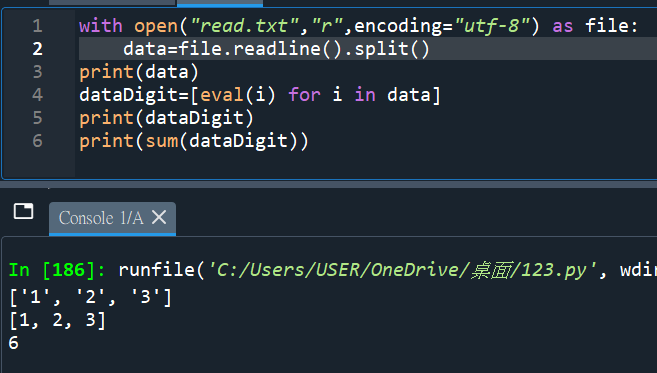
#用.readline()也可以
#少encoding=”utf-8″ 也行
“””
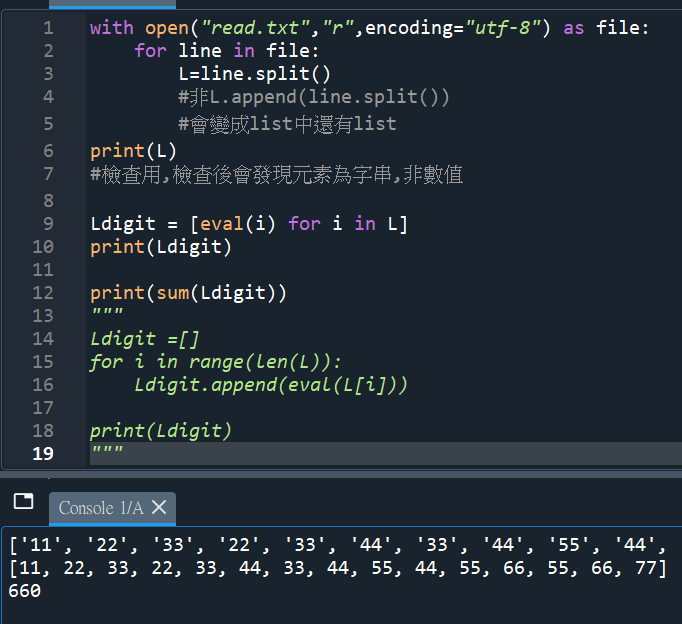
TQC txt檔的資料為:
11 22 33 22 33 44 33 44 55 44 55 66 55 66 77
雖然簡單,但還是可能使用
.append(line.split())
做成list中還有list
“””
, **dict(取value), *dict(取key)解包的差別? *第一個(不定長度)參數:打包為tuple,**最後一個(不定長度)選擇性參數:打包為dict,解包時dict的key要與參數的名稱一樣,而且不可多,不可少,解包與打包運算子")
")
,班排名=SUMPRODUCT((班級=A2)*(平均>M2))+1,設定格式化的條件")
取list()跟array()會如何? numpy.array(scalar) ; list(scalar), 2D array的運算")
 與 迭代器iter")

![Python: 如何使用functools.reduce逐步縮減可迭代對象,合併為單個結果? import functools; product = functools.reduce( lambda x, y: x * y, numbers) ; reduce(function, sequence [, initial]) -> value ; map(function, iterable) ; filter(function, iterable) ; map ; filter](https://i0.wp.com/savingking.com.tw/wp-content/uploads/2023/06/20230626093403_49.png?quality=90&zoom=2&ssl=1&resize=350%2C233 "Python: 如何使用functools.reduce逐步縮減可迭代對象,合併為單個結果? import functools; product = functools.reduce( lambda x, y: x * y, numbers) ; reduce(function, sequence [, initial]) -> value ; map(function, iterable) ; filter(function, iterable) ; map ; filter")
")
 or Spyder import模組執行後,出現no module找不到指定模組錯誤, settings.json , import sys ; lst = sys.path ; sys.path.append() ;Spyder: Tools => PYTHONPATH manager")
![Python: Regular Expression 正規表示法 正則表達式 import re ; pattn = "[d]{4}/[01][d]/[0123][d] [d]{6}" ; match = re .search (pattn,text) .group() - 儲蓄保險王](https://savingking.com.tw/wp-content/uploads/2022/09/20220901154435_19-520x245.png)

近期留言