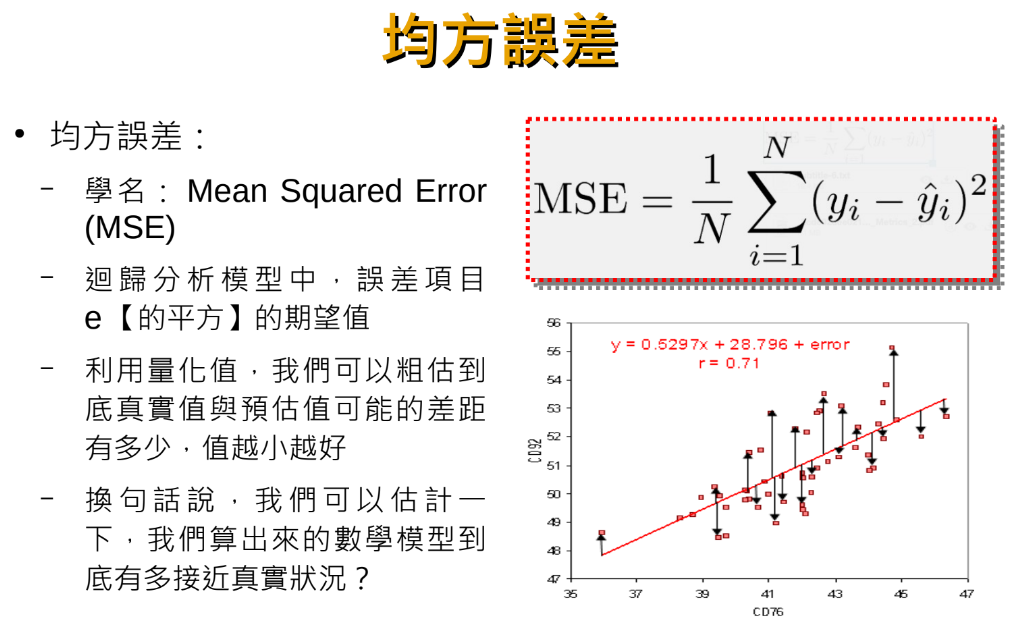
MSE(mean_squared_error):
from sklearn import linear_model,metrics #指標
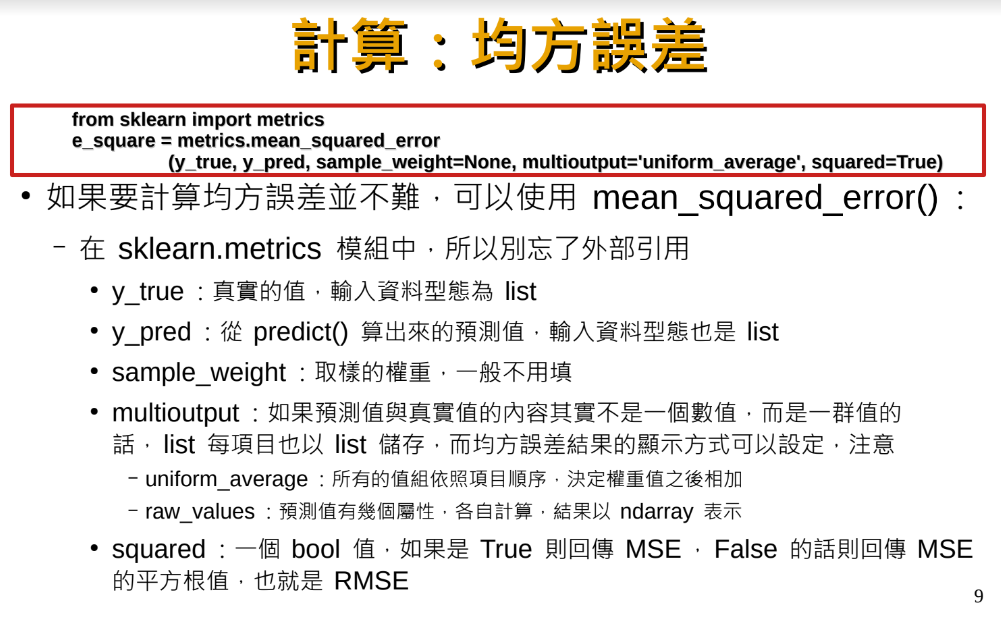
mse = metrics.mean_squared_error(ytest,ypredict)
判定係數(R-squared):
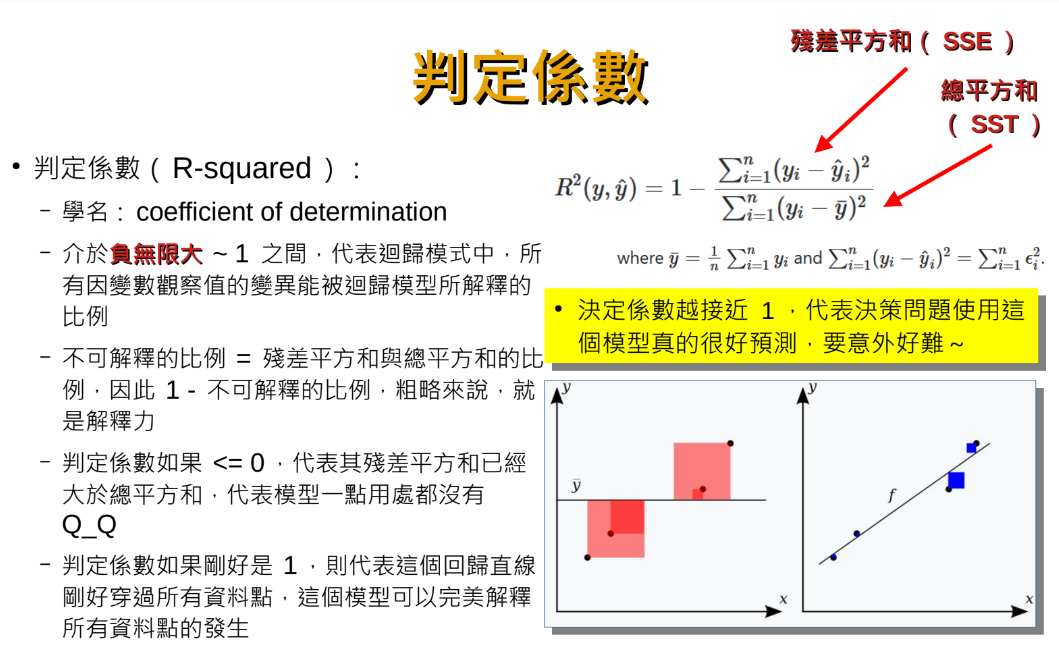
y^: 預測值
y bar: 平均值
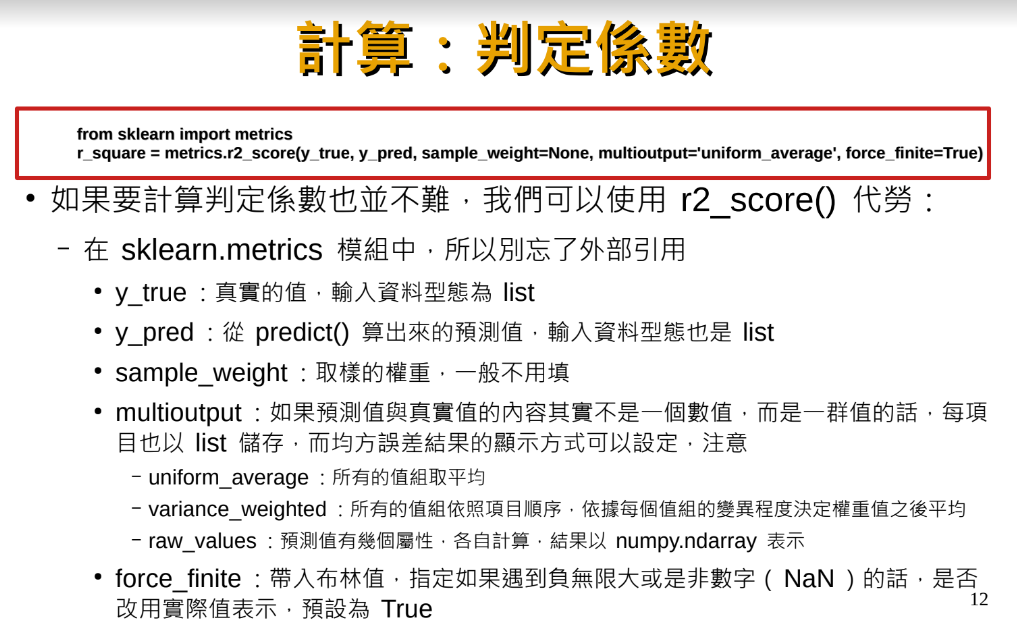
計算判定係數(R-squared):
皮爾森積差相關係數
(Pearson correlation coefficient):
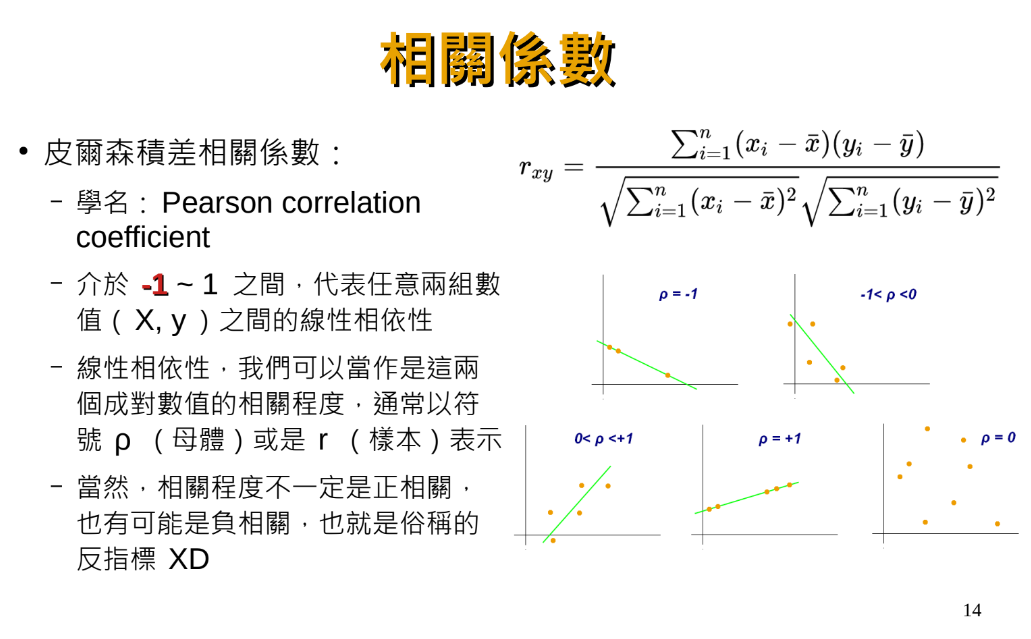
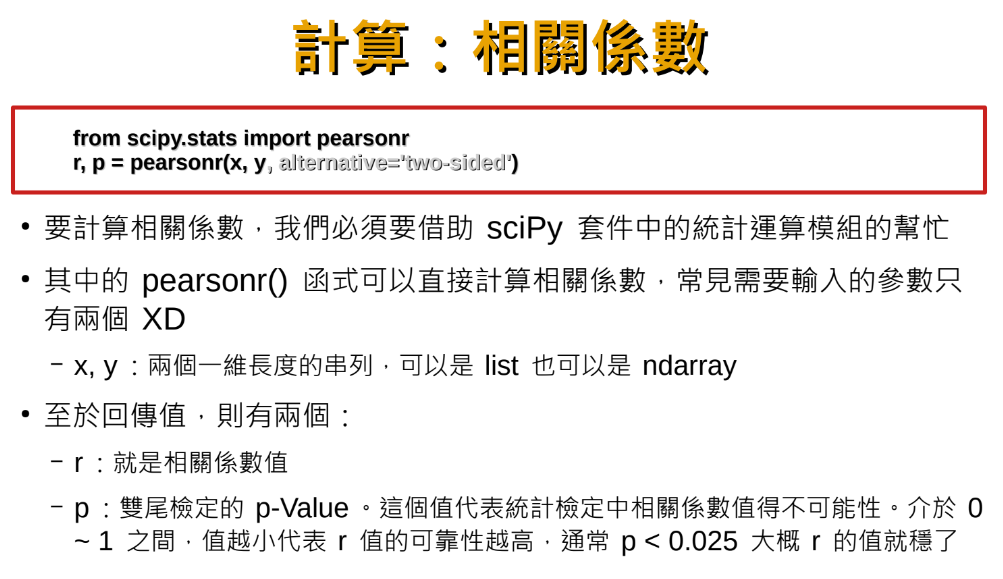
計算皮爾森積差相關係數:
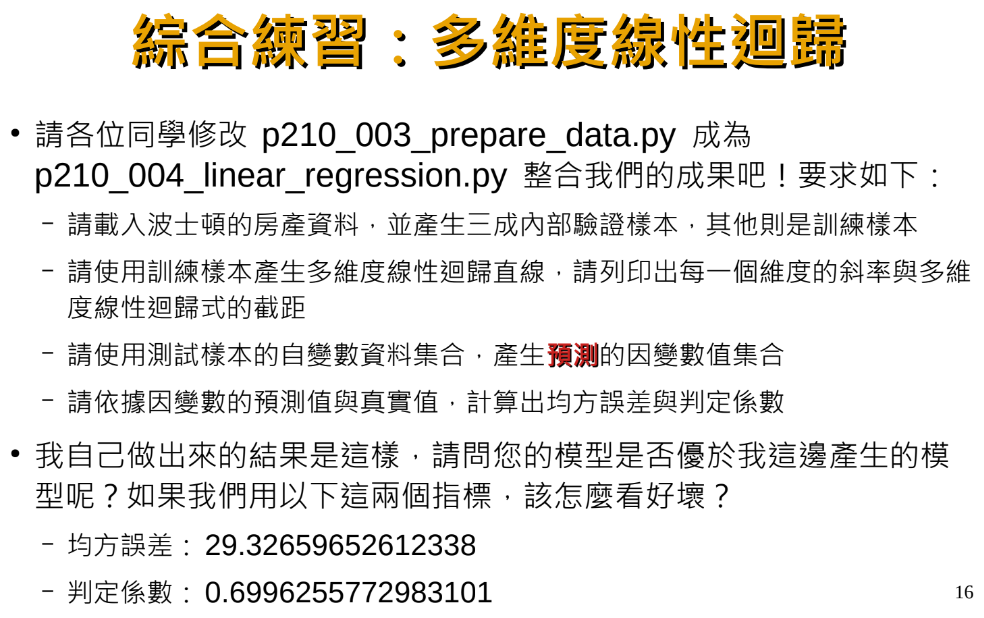
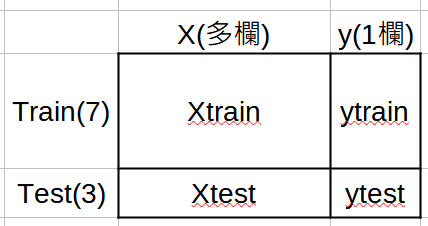
多維度線性迴歸:
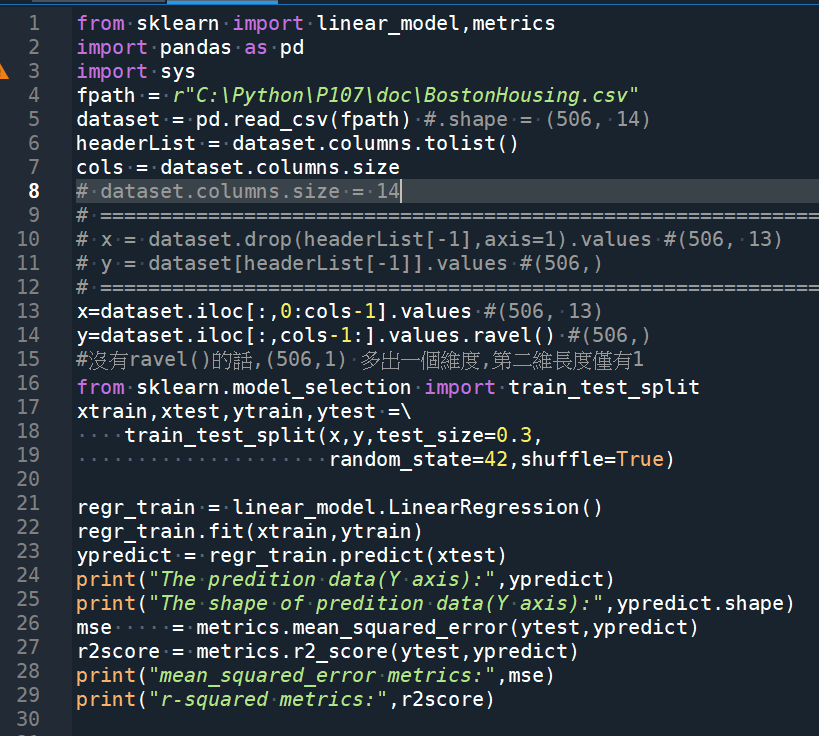
from sklearn import linear_model,metrics
import pandas as pd
import sys
fpath = r”C:\Python\P107\doc\BostonHousing.csv”
dataset = pd.read_csv(fpath) #.shape = (506, 14)
headerList = dataset.columns.tolist()
cols = dataset.columns.size
# dataset.columns.size = 14
# ==================================================
# x = dataset.drop(headerList[-1],axis=1).values #(506, 13)
# y = dataset[headerList[-1]].values #(506,)
# ==================================================
x=dataset.iloc[:,0:cols-1].values #(506, 13)
y=dataset.iloc[:,cols-1:].values.ravel() #(506,)
#沒有ravel()的話,(506,1) 多出一個維度,第二維長度僅有1
from sklearn.model_selection import train_test_split
xtrain,xtest,ytrain,ytest =\
train_test_split(x,y,test_size=0.3,
random_state=42,shuffle=True)
# 1. train_test_split()將原始資料切割為
# xtrain, xtest, ytrain, ytest
# =============================================
# print(“The shpae of training data(X axis):”,xtrain.shape)
# print(“The shpae of training data(Y axis):”,ytrain.shape)
# print(“The shpae of testing data(X axis):”,xtest.shape)
# print(“The shpae of testing data(Y axis):”,ytest.shape)
# ==============================================
regr_train = linear_model.LinearRegression()
#2. 建立LinearRegression操作子
regr_train.fit(xtrain,ytrain)
#3. 用. fit(xtrain, ytrain) 影響操作子
ypredict = regr_train.predict(xtest)
#4. 用.predict(xtest) 生出預測值ypredict
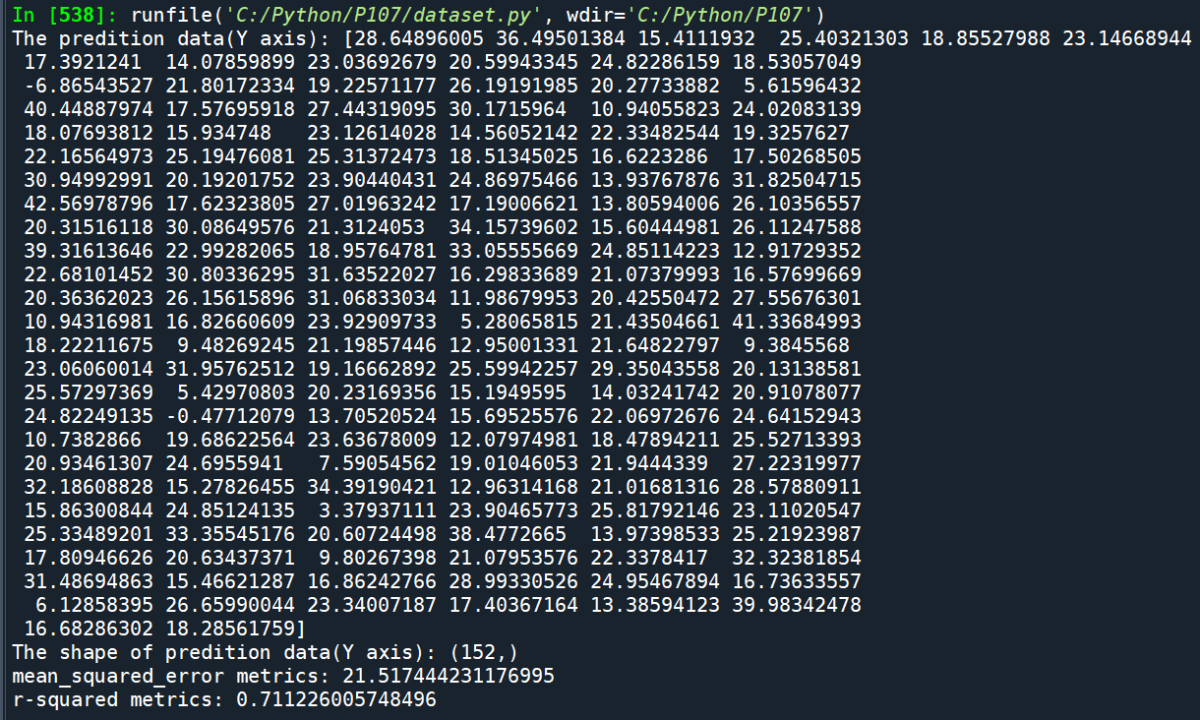
print(“The predition data(Y axis):”,ypredict)
print(“The shape of predition data(Y axis):”,ypredict.shape)
mse = metrics.mean_squared_error(ytest,ypredict)
r2score = metrics.r2_score(ytest,ypredict)
# 5. ytest是真實資料,ypredict是預測值,
#有這兩者就可以用來計算mse跟r2_score
print(“mean_squared_error metrics:”,mse)
print(“r-squared metrics:”,r2score)
輸出結果:
p value:

推薦hahow線上學習python: https://igrape.net/30afN
 #封裝 CT_P (Complex Type Paragraph)為 Paragraph 物件")
取list()跟array()會如何? numpy.array(scalar) ; list(scalar), 2D array的運算")
; hash_obj = hashlib.sha256(data); result = hash_obj.hexdigest() #digest:「取得雜湊摘要」或「取得摘要值」")
 : re.Match 物件的 .group() .groups()方法 #捕獲組")


將 JSON 逐筆自動轉成中文自然語言")
; from bs4 import BeautifulSoup")


近期留言