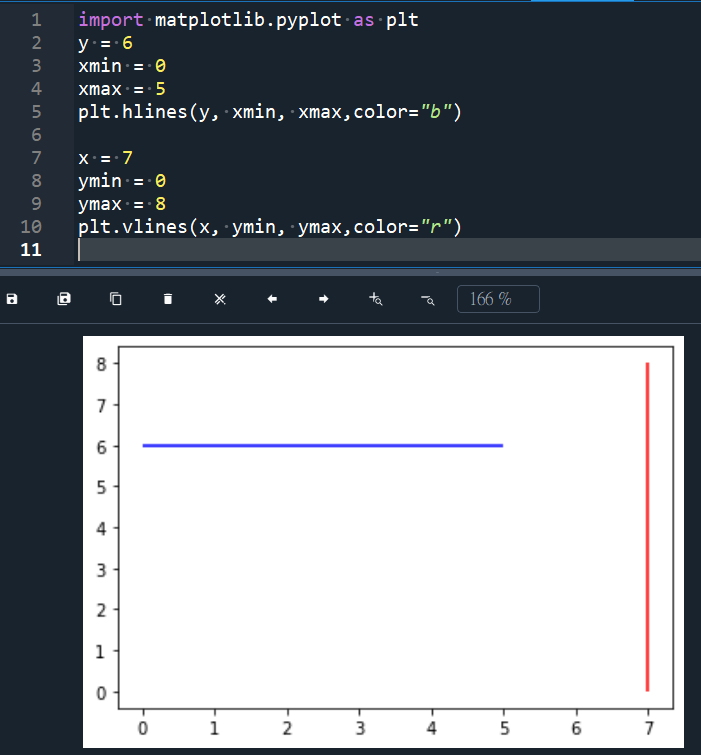
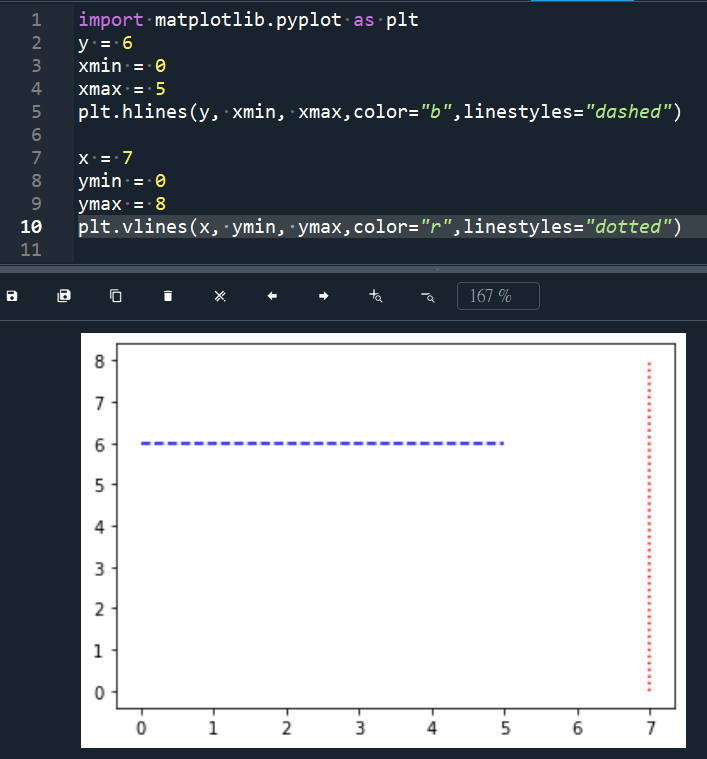
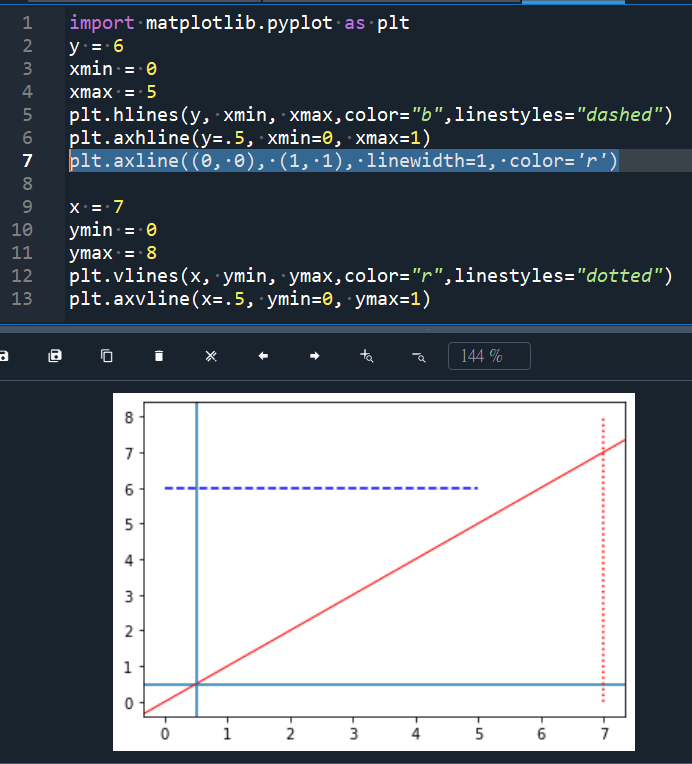
import matplotlib.pyplot as plt
y = 6
xmin = 0
xmax = 5
plt.hlines(y, xmin, xmax,color=”b”)
x = 7
ymin = 0
ymax = 8
plt.vlines(x, ymin, ymax,color=”r”)
axhline, axvline
matplotlib.pyplot.axhline(y=0, xmin=0, xmax=1, **kwargs)
y
float, default: 0
y position in data coordinates of the horizontal line.
xmin
float, default: 0
Should be between 0 and 1, 0 being the far left of the plot, 1 the far right of the plot.
xmax
float, default: 1
Should be between 0 and 1, 0 being the far left of the plot, 1 the far right of the plot.
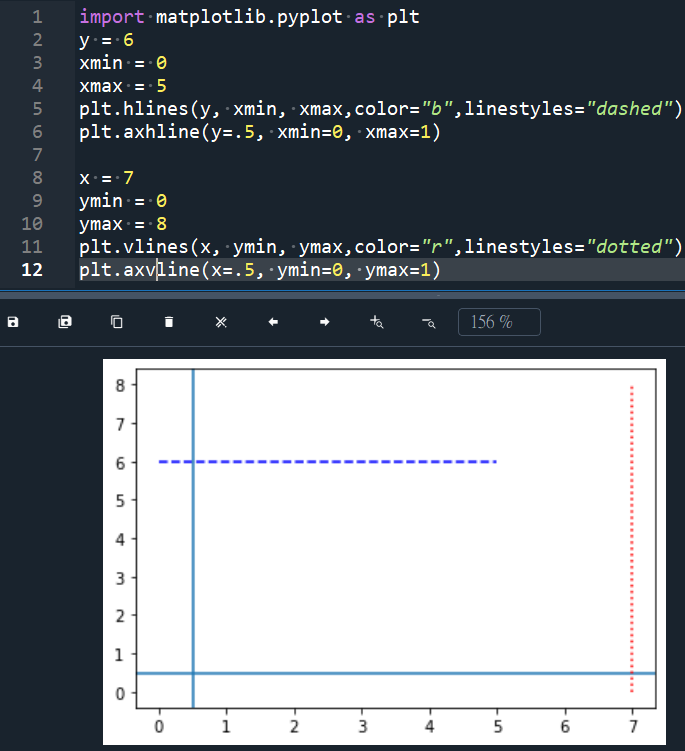
axhline設定xmin,xmax的效果:
plt.axline((0, 0), (1, 1), linewidth=1, color=’r’)
推薦hahow線上學習python: https://igrape.net/30afN
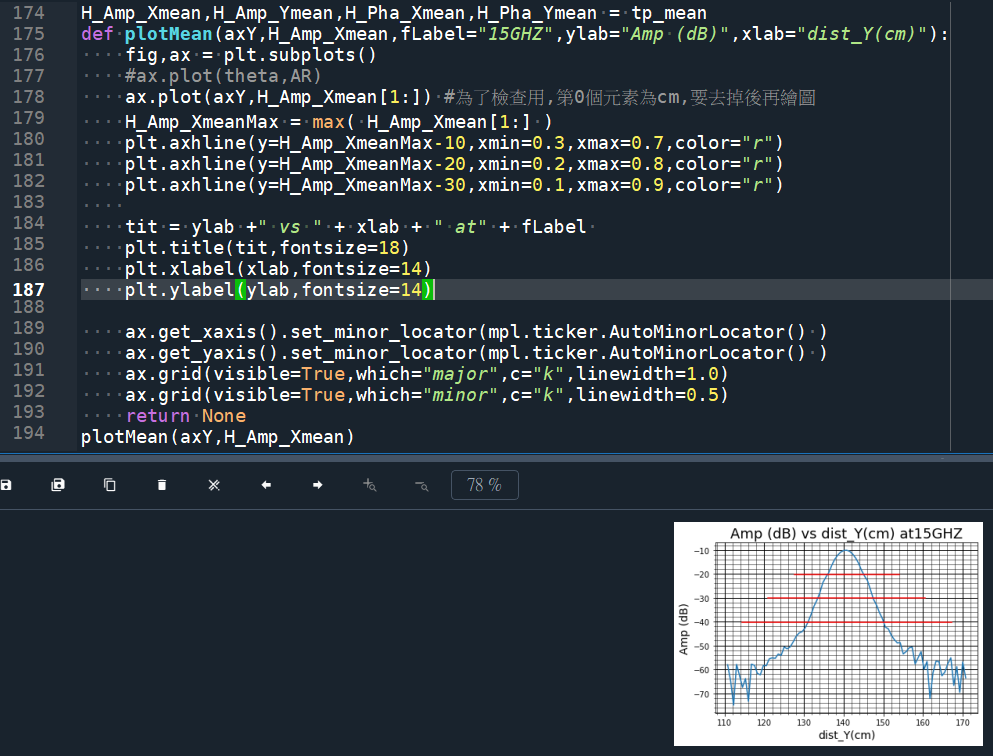
使用 plt.text() 函数在图上添加文本注释
plt.text(0, -3.2, “max-3B”, ha=”center”, va=”top”, fontsize=12):
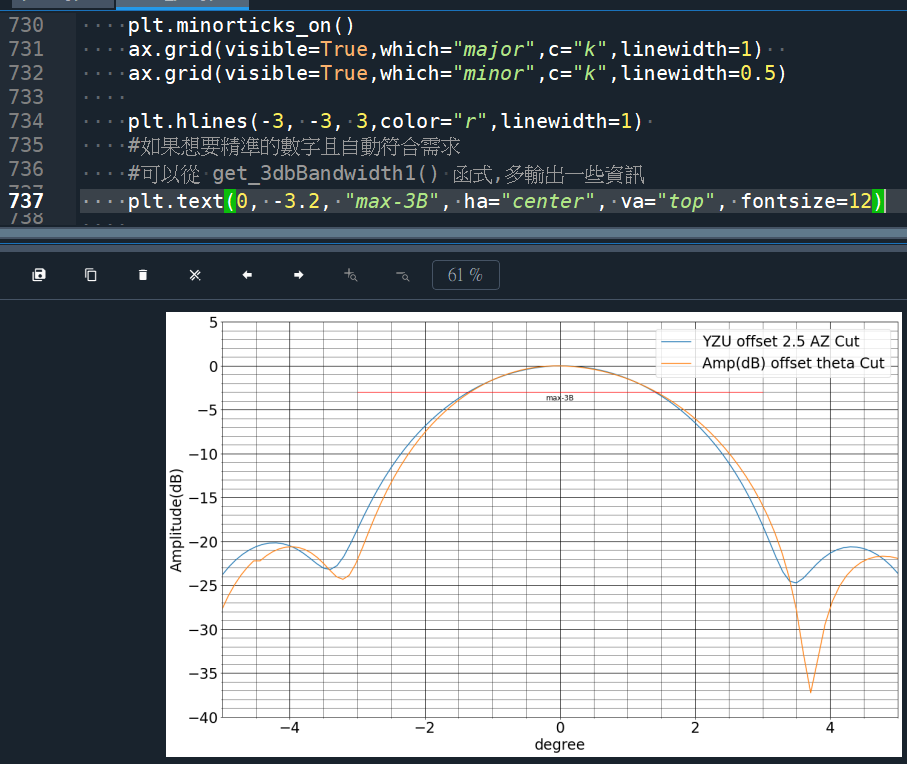
plt.text() 函数的第一个参数是 x 坐标,
第二个参数是 y 坐标,
这里的 (0, -3.2) 是希望把文本放在
横坐标为 0,
纵坐标为 -3.2 的位置。
ha 参数是文本水平对齐方式,
va 参数是文本垂直对齐方式,
fontsize 参数是文本字体大小。
推薦hahow線上學習python: https://igrape.net/30afN

 ; ax.xaxis.tick_top() ; ax.set_xticks( ticks=list1, label=list2, rotation=45) #幫刻度值取別名; 如何用loc參數設定title/label位置?存檔的圖片若被裁切如何設定? bbox_inches = ‘tight’")

, isdigit()")
 as source: audio = r.record(source) ; 如何使用mic當音源? with sr.Microphone() as source: audio_data = recognizer.listen(source)")
![Python, typing: 函數庫規格標註; def addTest(x:float, y:float) -> float: List[資料型態] Set[資料型態] Tuple[資料型態] Dict[str,value的資料型態] Union[資料型態1, 資料型態2] ,函式若有多個輸出值,其實是輸出一個tuple](https://i0.wp.com/savingking.com.tw/wp-content/uploads/2022/09/20220907154601_86.png?quality=90&zoom=2&ssl=1&resize=350%2C233 "Python, typing: 函數庫規格標註; def addTest(x:float, y:float) -> float: List[資料型態] Set[資料型態] Tuple[資料型態] Dict[str,value的資料型態] Union[資料型態1, 資料型態2] ,函式若有多個輸出值,其實是輸出一個tuple")
 ) ; for idx, sea in enumerate (seasons, start=1): print(idx,sea)")
:使用 ignore_index=True 合併 DataFrame 的奧秘 #效果同 reset_index( drop=True )")


近期留言