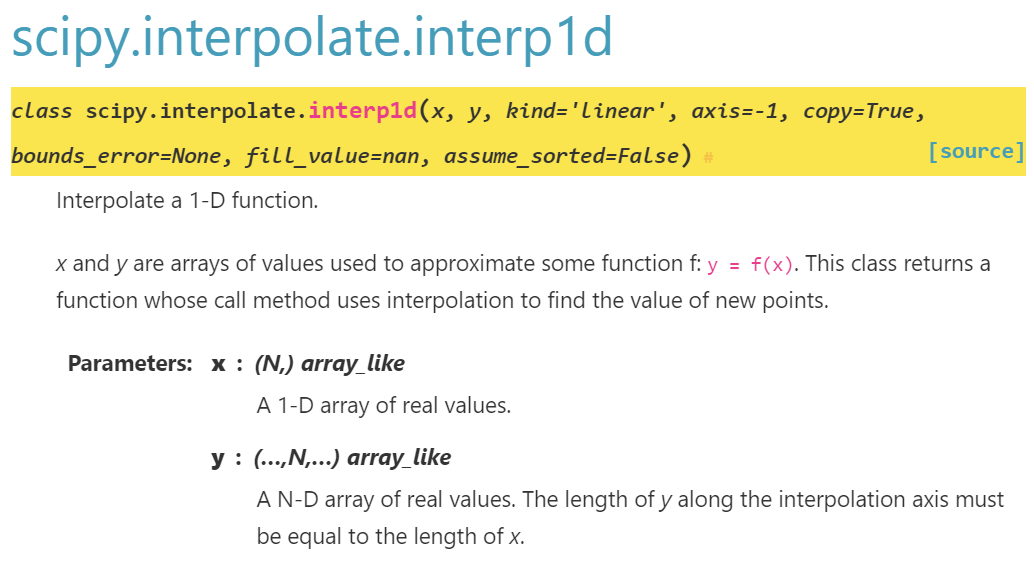
x: 1D array,
y只要長度同x即可,沒限制要1D
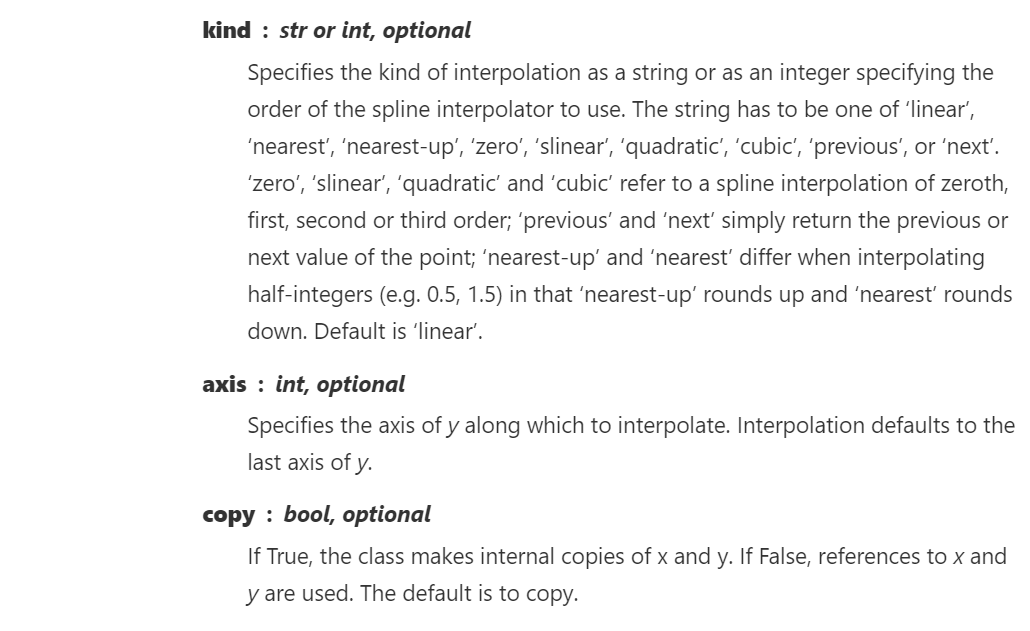
axis: Specifies the axis of y along which to interpolate.
Interpolation defaults to the last axis of y.
y是2D資料(last axis=axis 1)時要特別小心,
axis=0才能對直欄資料做內插
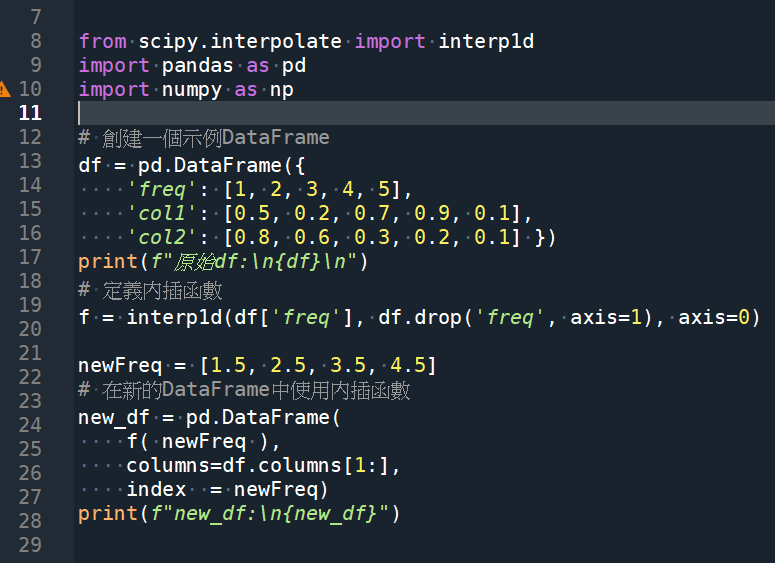
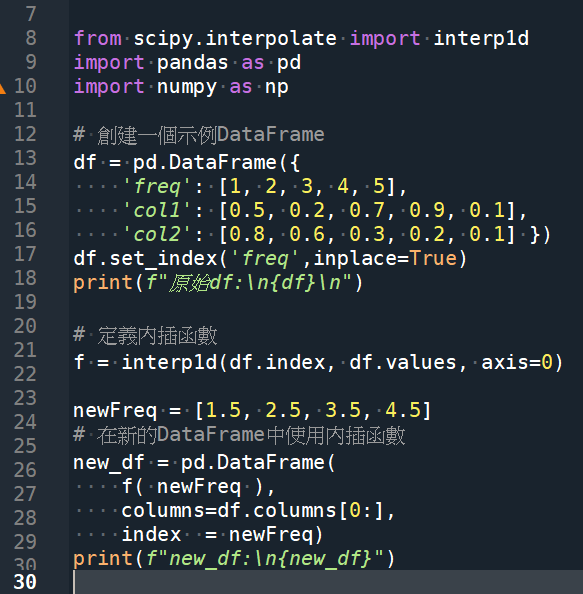
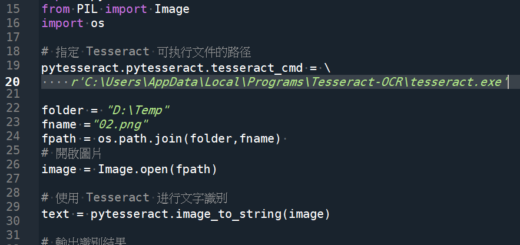
from scipy.interpolate import interp1d
import pandas as pd
import numpy as np
# 創建一個示例DataFrame
df = pd.DataFrame({
'freq': [1, 2, 3, 4, 5],
'col1': [0.5, 0.2, 0.7, 0.9, 0.1],
'col2': [0.8, 0.6, 0.3, 0.2, 0.1] })
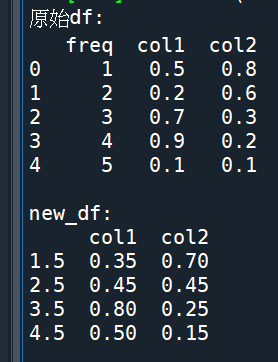
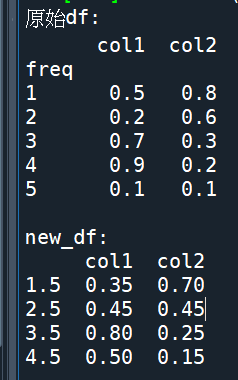
print(f"原始df:\n{df}\n")
# 定義內插函數
f = interp1d(df['freq'], df.drop('freq', axis=1), axis=0)
"""莫忘最後的axis=0,沿直欄做內插法,不然會觸發
raise ValueError("x and y arrays must be equal in length along "
ValueError: x and y arrays must be equal in length along interpolation axis.
"""
newFreq = [1.5, 2.5, 3.5, 4.5]
# 在新的DataFrame中使用內插函數
new_df = pd.DataFrame(
f( newFreq ),
columns=df.columns[1:],
index = newFreq)
print(f"new_df:\n{new_df}")code:
f = interp1d(df[‘freq’], df.drop(‘freq’, axis=1), axis=0)
“””莫忘最後的axis=0,沿直欄做內插法,不然會觸發
raise ValueError(“x and y arrays must be equal in length along “
ValueError: x and y arrays must be equal in length along interpolation axis.
“””
output:
推薦hahow線上學習python: https://igrape.net/30afN
使用: df.set_index(‘freq’, inplace=True)
將原始df的頻率也放進去index中
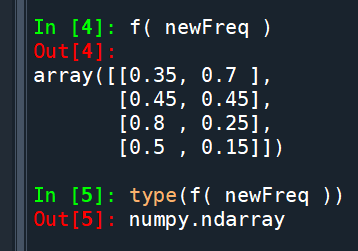
f( newFreq ) 是ndarray,
若沒有重新將之變為DataFrame
不要誤用columns定位
output:
內插法若是出現類似以下錯誤:
File C:\ProgramData\Anaconda\lib\site-packages\scipy\interpolate_interpolate.py:781 in _check_bounds
raise ValueError(“A value ({}) in x_new is below “
ValueError: A value (24.0) in x_new is below the interpolation range’s minimum value (24.000000000000018).
func28 = interp1d(f28, ser28Loss,axis=0, fill_value=”extrapolate”)fill_value="extrapolate" 是 interp1d 函數的一個參數,用於指定在內插時處理超出原始資料範圍的點的方式。這個參數的作用是進行外插(extrapolation),也就是根據已知資料的趨勢估算超出範圍的點的值。
推薦hahow線上學習python: https://igrape.net/30afN
字串與字串的對齊{:8.2f}預設靠右, {:<8.2f}靠左,{:>8.2f}靠右,{:^8.2f}置中,{:=^10s}”.format(“傳說中的分隔線”) ; print(f”{s:=<10}\") ; \"傳說中的分隔符號\".center(40, \"=\")")
如何設定sep參數才能讀取分隔子同時有, ” ” (空白)的csv檔? df = pd.read_csv(‘test.txt’, sep = ‘\s*,\s*|\s+’, engine=’python’)")
 vs Path.glob() 誰更好用?")

")
 客戶端:Azure、OpenAI 與 Poe 整合指南")

![Python 表達式中的魔法:用海象運算子讓斷詞程式碼更乾淨 [w_clean for w in words if (w_clean:=w.lower().strip()) and w_clean not in STOPWORDS]](https://i0.wp.com/savingking.com.tw/wp-content/uploads/2026/02/20260210083748_0_a7d9bf.png?quality=90&zoom=2&ssl=1&resize=350%2C233 "Python 表達式中的魔法:用海象運算子讓斷詞程式碼更乾淨 [w_clean for w in words if (w_clean:=w.lower().strip()) and w_clean not in STOPWORDS]")


近期留言