import pandas as pd
import numpy as np
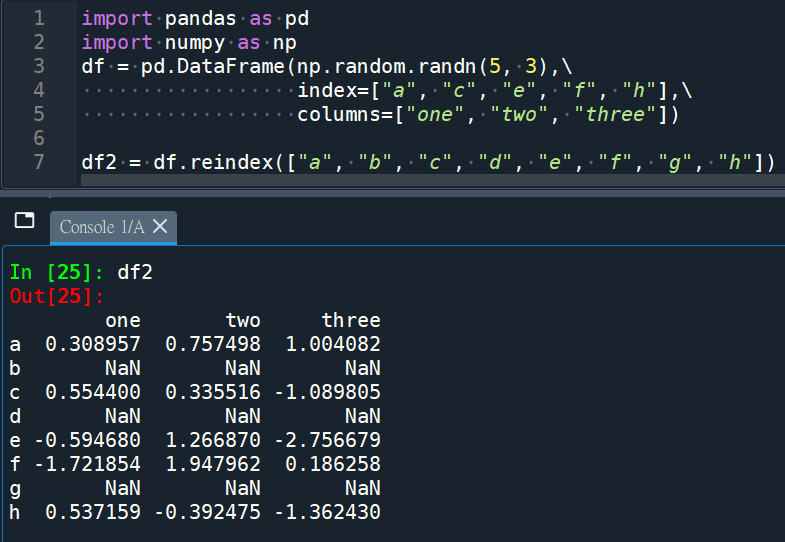
df = pd.DataFrame(np.random.randn(5, 3),\
index=[“a”, “c”, “e”, “f”, “h”],\
columns=[“one”, “two”, “three”])
df2 = df.reindex([“a”, “b”, “c”, “d”, “e”, “f”, “g”, “h”])
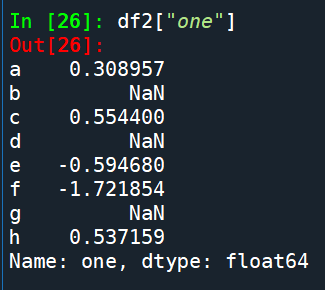
df2[“one”]:
df2[“one”].isna():
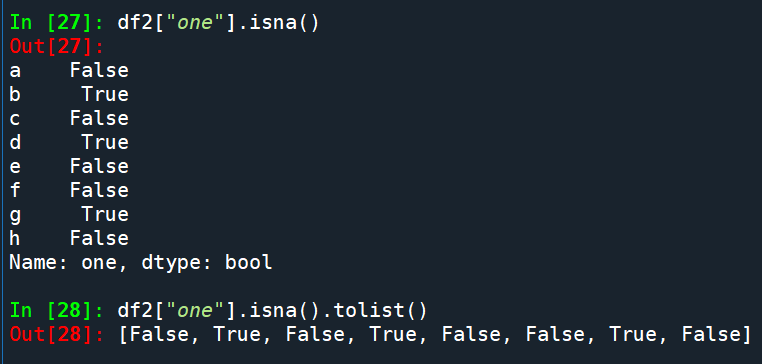
df2[“one”].isna().tolist()
得到一個bool list
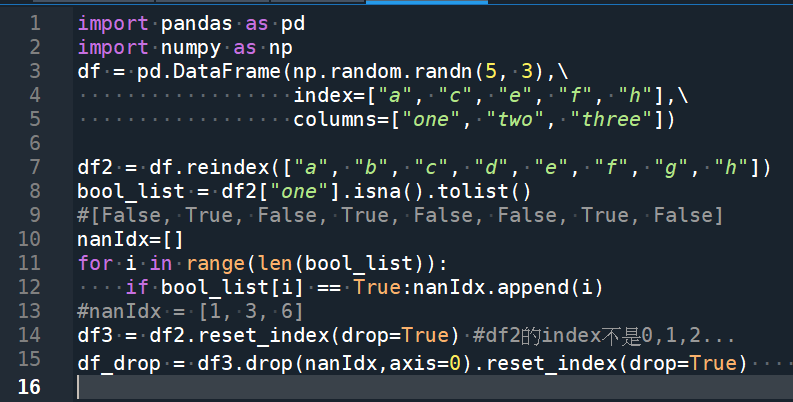
以下處理可以刪除空白列:
import pandas as pd
import numpy as np
df = pd.DataFrame(np.random.randn(5, 3),\
index=[“a”, “c”, “e”, “f”, “h”],\
columns=[“one”, “two”, “three”])
df2 = df.reindex([“a”, “b”, “c”, “d”, “e”, “f”, “g”, “h”])
bool_list = df2[“one”].isna().tolist()
#[False, True, False, True, False, False, True, False]
nanIdx=[]
for i in range(len(bool_list)):
if bool_list[i] == True:nanIdx.append(i)
#nanIdx = [1, 3, 6]
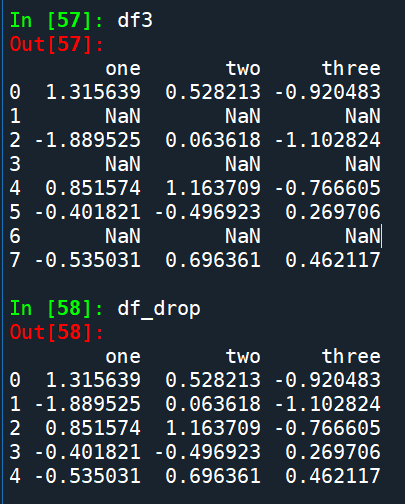
df3 = df2.reset_index(drop=True)
#df2的index不是0,1,2,3…
df_drop = df3.drop(nanIdx,axis=0).reset_index(drop=True)
#對df2處理會出現
# KeyError: ‘[1, 3, 6] not found in axis’
#因為df2的index是a,b,c,d…
#如果df2的index沒有從0開始或沒連續,也要小心
#.reset_index(drop=True) 重要!
結果:
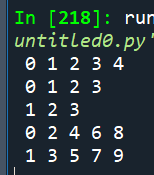
) ; reduce( lambda acc, x: acc + x, map(lambda x: x * 2, filter(lambda x: x % 2 == 0, numbers)))")
")
、flatten()、reshape(-1)將多維array轉換成一維")
 ,以免觸發ValueError: The truth value of a Series is ambiguous. Use a.empty, a.bool(), a.item(), a.any() or a.all().")
![Python爬蟲:BeautifulSoup的 .find_all() 與 .find() 與 .select(‘標籤名[屬性名1=”屬性值1″][屬性名2=”屬性值2″]’) ; from bs4 import BeautifulSoup ; Live Server(可以預覽HTML的VS Code套件)](https://i0.wp.com/savingking.com.tw/wp-content/uploads/2025/03/20250330190318_0_925655.jpg?quality=90&zoom=2&ssl=1&resize=350%2C233 "Python爬蟲:BeautifulSoup的 .find_all() 與 .find() 與 .select(‘標籤名[屬性名1=”屬性值1″][屬性名2=”屬性值2″]’) ; from bs4 import BeautifulSoup ; Live Server(可以預覽HTML的VS Code套件)")
![Python 如何用pandas.Series.nsmallest() 找到n個與target差距最小的index?再從中找到距離idxmax最近的index?避免誤抓sidelobes的index? targetIdx = (serMean-target_value).abs().nsmallest(n).index.tolist() ;Series切片: .loc[標籤名1:標籤名2] (會含標籤名2) ; .iloc[位置1:位置2] (不含位置2)](https://i1.wp.com/savingking.com.tw/wp-content/uploads/2023/02/20230222082954_53.png?quality=90&zoom=2&ssl=1&resize=350%2C233 "Python 如何用pandas.Series.nsmallest() 找到n個與target差距最小的index?再從中找到距離idxmax最近的index?避免誤抓sidelobes的index? targetIdx = (serMean-target_value).abs().nsmallest(n).index.tolist() ;Series切片: .loc[標籤名1:標籤名2] (會含標籤名2) ; .iloc[位置1:位置2] (不含位置2)")
,dtype=int) ; B = np.zeros((2,3,4),dtype=int)")
![Python:如何將folder_path & file_name合併為file_path? fpath = os.path.join (folder , fname) #不需要[ ]包覆folder,fname; fpath1 = “\\”.join( [folder , fname] ) #需要[ ] 包覆folder,fname ; 反過來講,file_path如何拆分為folder_path & file_name? os.path.dirname() ; os.path.basename() ; file_name如何拆分為主檔名與副檔名os.path.splitext() #split(分裂) ext](https://i2.wp.com/savingking.com.tw/wp-content/uploads/2023/07/20230717184401_87.png?quality=90&zoom=2&ssl=1&resize=350%2C233 "Python:如何將folder_path & file_name合併為file_path? fpath = os.path.join (folder , fname) #不需要[ ]包覆folder,fname; fpath1 = “\\”.join( [folder , fname] ) #需要[ ] 包覆folder,fname ; 反過來講,file_path如何拆分為folder_path & file_name? os.path.dirname() ; os.path.basename() ; file_name如何拆分為主檔名與副檔名os.path.splitext() #split(分裂) ext")
 ; str.isspace() ; str.isalpha()")


近期留言