dropna(axis=0, how=’any’, thresh=None, subset=None, inplace=False)
axis{0 or ‘index’, 1 or ‘columns’}, default 0
-
0, or ‘index’ : Drop rows which contain missing values.
-
1, or ‘columns’ : Drop columns which contain missing value.
how{‘any’, ‘all’}, default ‘any’
-
‘any’ : If any NA values are present, drop that row or column.
- ‘any’: 只要有一個NA,就整列(欄)刪除
-
‘all’ : If all values are NA, drop that row or column.
- ‘all’: 全部都NA,才刪除該列(欄)
thresh : int, optional
Require that many non-NA values. Cannot be combined with how.
(threshold 門檻)
非空元素最低数量。int型,默认为None。
如果该行/列中,非空元素数量小于这个值,就删除该行/列。
subset column label or sequence of labels, optional
Labels along other axis to consider, e.g. if you are dropping rows these would be a list of columns to include.
inplace bool, default False
Whether to modify the DataFrame rather than creating a new one.
inplace:是否原地替换。布尔值,默认为False
直接將csv檔讀進來DataFrame:
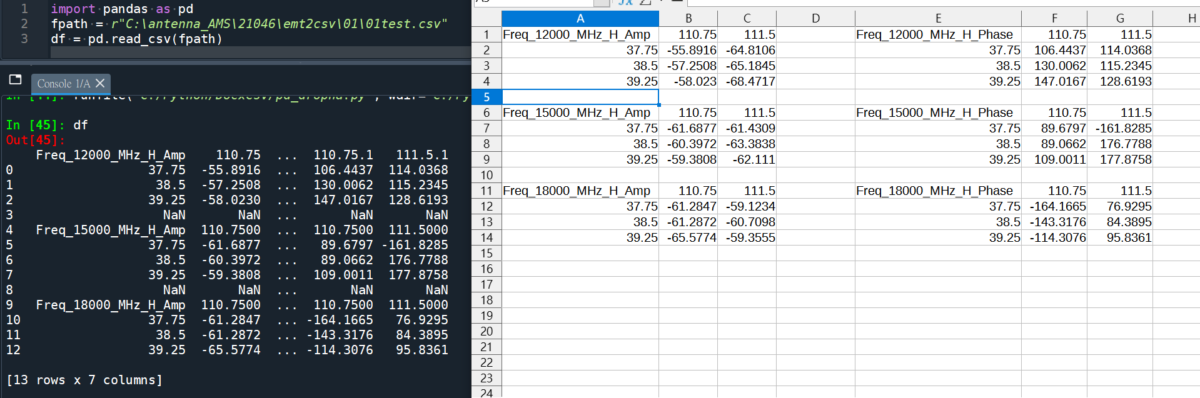
原DataFrame有
[13 rows x 7 columns]
其中2 rows , 1 column 為空(NaN)
程式碼:
import pandas as pd
fpath = r”C:\antenna_AMS\21046\emt2csv\01\01test.csv”
df = pd.read_csv(fpath)
#df = pd.read_csv(fpath,header=None) ;
# 讀取無欄標籤的檔案,自動加0,1,2…當欄標籤
df_drop0 = df.dropna(axis=0, how=’all’)
#先drop空列,axis=0
df_drop1 = df_drop0.dropna(axis=1,how=’all’)
#再drop空欄,axis=1
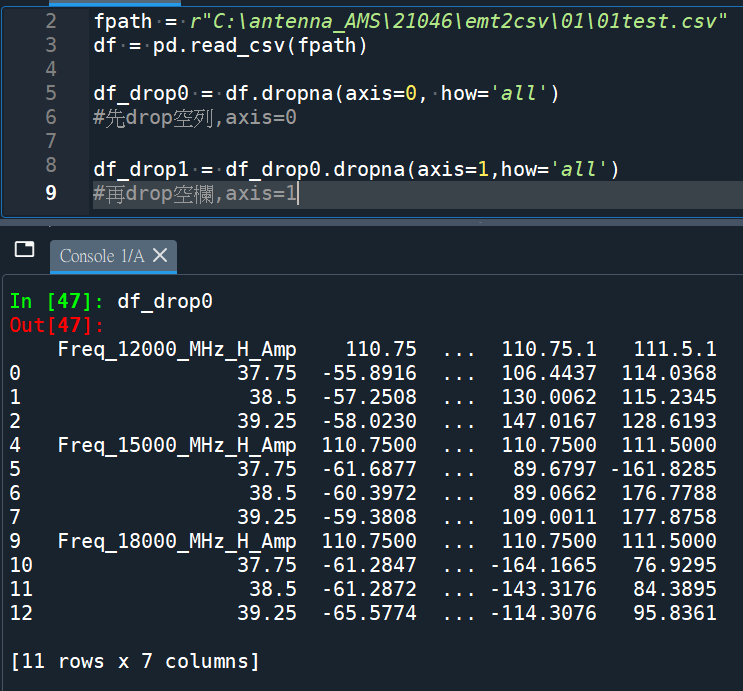
df_drop0 = df.dropna(axis=0, how=’all’)
[11 rows x 7 columns]
刪除了兩空列
df_drop1 = df_drop0.dropna(axis=1,how=’all’)
對df_drop0再drop空欄(axis=1)
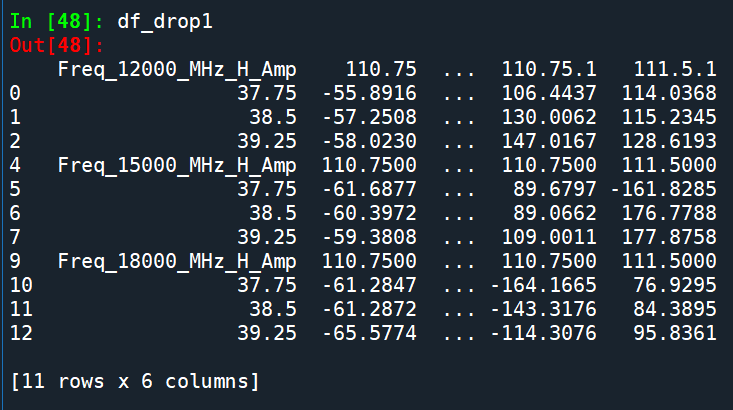
[11 rows x 6 columns]
刪除了一個空欄
刪除空列會導致index不連續
推薦hahow線上學習python: https://igrape.net/30afN
, x)` ; sorted(items, key=lambda x: (-len(x), x)) 與 json_repair strategy pipeline")

; typing : np.ndarray")
, Null (null), Object(對應python的dict), Array(對應python的list); Python如何讀取json檔?")
 ; set1 = set(dic) #2D list可以轉為dict, dict的key可以轉為set")
; self.radius=1")


 or(|) xor(^) not ; assert 預期為真的條件式, “錯誤訊息” ; 條件式為真的話,繼續往下跑,否則AssertionError: “錯誤訊息”")

![Python 讀取 DOCX 圖片關聯:qn+find/findall 與 XPath 的實戰對照 from lxml import etree ; from docx.oxml.ns import qn; lxml.etree._Element.findall( f".//{ qn('a:blip') }" ) ; .get( qn("r:embed") ) #獲取 屬性名 'r:embed' 的 屬性值(如: 'rId4') ; lxml.etree._Element.xpath( "//a:blip/@r:embed", namespaces = NS) #/@r:embed = 獲取 屬性名 'r:embed' 的 屬性值(如: 'rId4'),使用.findall() 要先.findall()獲取List[_Element],再迴圈_Element.get()獲取屬性值, .xpath() 第一個參數path 使用"//a:blip/@r:embed" ,可直接獲取屬性值(List[str]如: ['rId4', 'rId5']) ; 如何對docx真實移除圖片瘦身? - 儲蓄保險王](https://savingking.com.tw/wp-content/uploads/2025/11/20251119130848_0_3fbf6b-520x245.png)

近期留言