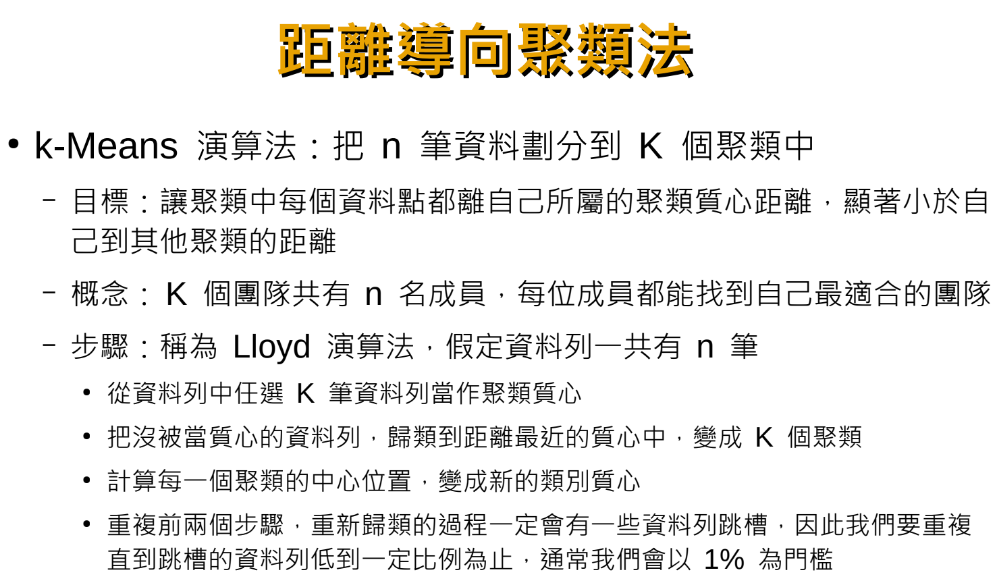
k-Means 演算法:
k種聚類, k怎麼取?
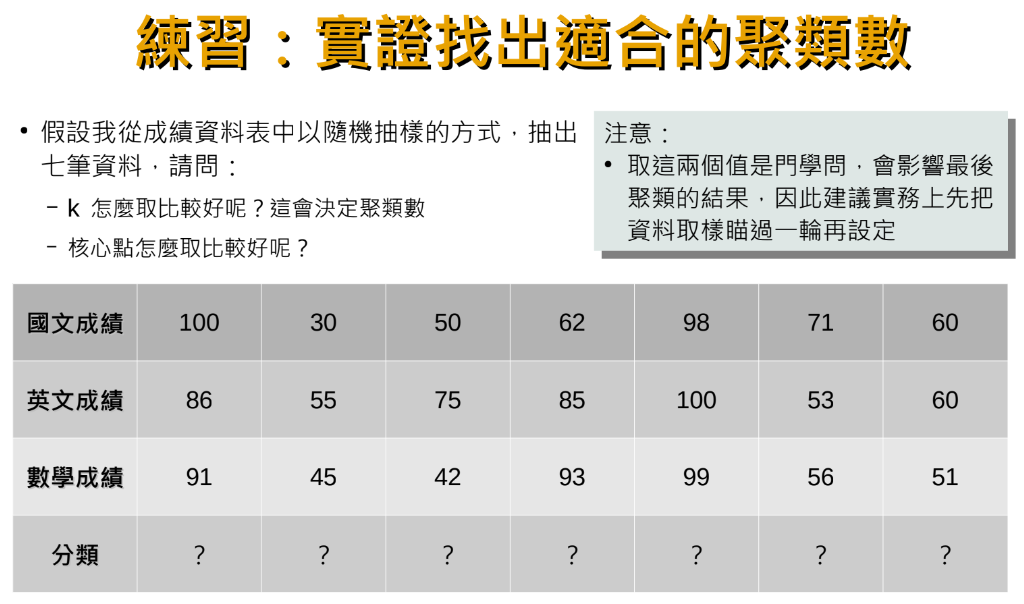
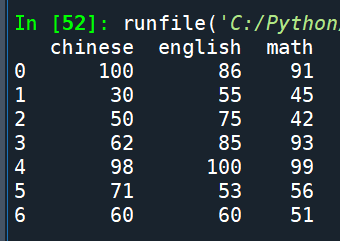
測試資料:
| chinese | english | math |
| 100 | 86 | 91 |
| 30 | 55 | 45 |
| 50 | 75 | 42 |
| 62 | 85 | 93 |
| 98 | 100 | 99 |
| 71 | 53 | 56 |
| 60 | 60 | 51 |
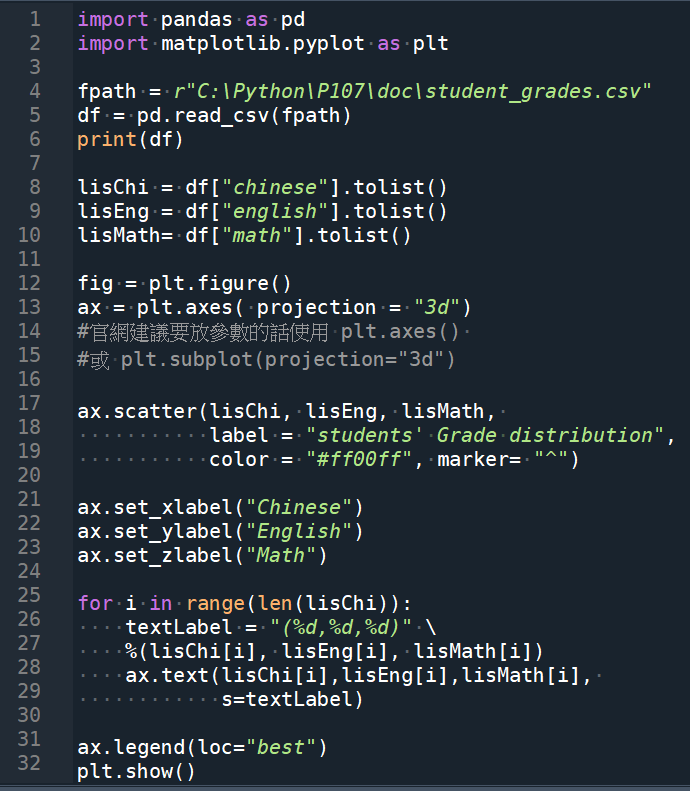
import pandas as pd
import matplotlib.pyplot as plt
fpath = r”C:\Python\P107\doc\student_grades.csv”
df = pd.read_csv(fpath)
print(df)
lisChi = df[“chinese”].tolist()
lisEng = df[“english”].tolist()
lisMath= df[“math”].tolist()
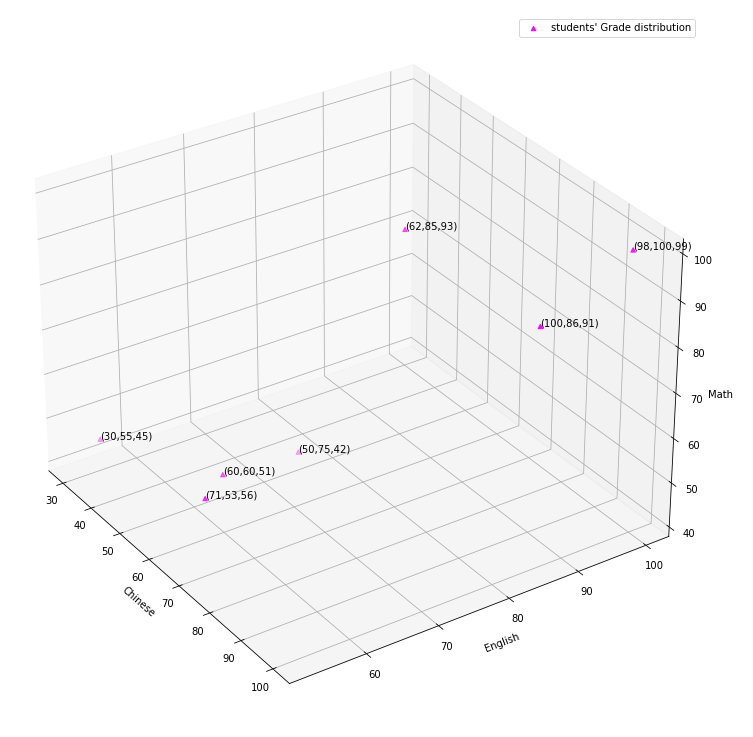
fig = plt.figure()
ax = plt.axes( projection = “3d”)
#官網建議要放參數的話使用 plt.axes()
#或 plt.subplot(projection=”3d”)
ax.scatter(lisChi, lisEng, lisMath,
label = “students’ Grade distribution”,
color = “#ff00ff”, marker= “^”)
ax.set_xlabel(“Chinese”)
ax.set_ylabel(“English”)
ax.set_zlabel(“Math”)
for i in range(len(lisChi)):
textLabel = “(%d,%d,%d)” \
%(lisChi[i], lisEng[i], lisMath[i])
ax.text(lisChi[i],lisEng[i],lisMath[i],
s=textLabel)
ax.legend(loc=”best”)
plt.show()
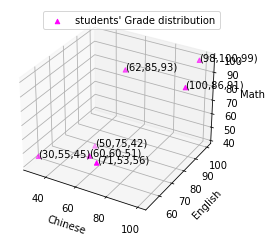
“””
spyder內嵌的靜態圖片無法用滑鼠改變視角
console中輸入:
%matplotlib qt
再執行py檔,會生出可互動的獨立視窗
%matplotlib inline
切換回原本的內嵌模式
“””
print(df):
%matplotlib qt
可互動的3D散佈圖:
%matplotlib inline
內嵌無法互動的靜態3D散佈圖:
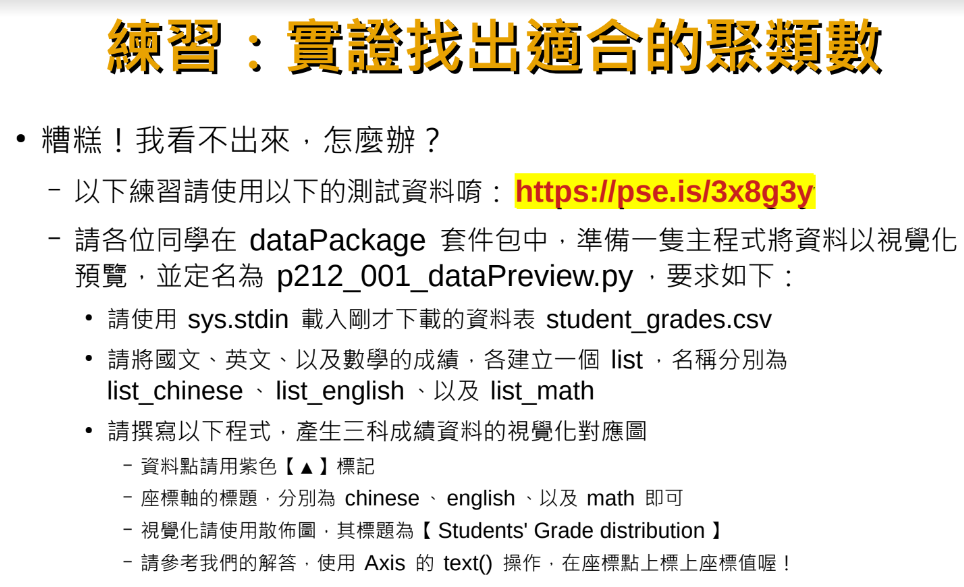
推薦hahow線上學習python: https://igrape.net/30afN
 ,19歲奧運跆拳銅牌美少女羅嘉翎的國光獎金,應該一次領500萬?還是終身月領2.4萬?Excel財務函數PMT, RATE, NPER, PV, FV")

 ; 如何將資料夾中的多個csv檔求平均?")

 ; re.search() ; re.findall() ; re.fullmatch() 有何差別?")
 = groupby() + pivot() ; crosstab()")


![Python如何讀寫csv逗點分隔檔(每列內容為新光增有利現金流)?pandas.read_csv(r”路徑\檔名.副檔名”),如何移除list中的nan元素?math.isnan(),如何計算新光增有利IRR?numpy_financial(array) ;輸出csv檔時如何去掉index跟header?如何選擇要寫入的直欄columns? dfFinal.to_csv(fpath, index=False, header=None, columns=[0,1])](https://i1.wp.com/savingking.com.tw/wp-content/uploads/2022/11/20221110122900_3.png?quality=90&zoom=2&ssl=1&resize=350%2C233 "Python如何讀寫csv逗點分隔檔(每列內容為新光增有利現金流)?pandas.read_csv(r”路徑\檔名.副檔名”),如何移除list中的nan元素?math.isnan(),如何計算新光增有利IRR?numpy_financial(array) ;輸出csv檔時如何去掉index跟header?如何選擇要寫入的直欄columns? dfFinal.to_csv(fpath, index=False, header=None, columns=[0,1])")


近期留言