import numpy as np
import matplotlib as mpl
import matplotlib.pyplot as plt
#import seaborn as sbn
PI = np.pi
x = np.linspace(0,2*PI,100)
y = np.sin(x)
fig, ax = plt.subplots(1,1)
#這行可改為: ax=plt.axes()
#但 fig, ax = plt.subplots() 較好
#fig.savefig() 存檔時, 需要fig物件
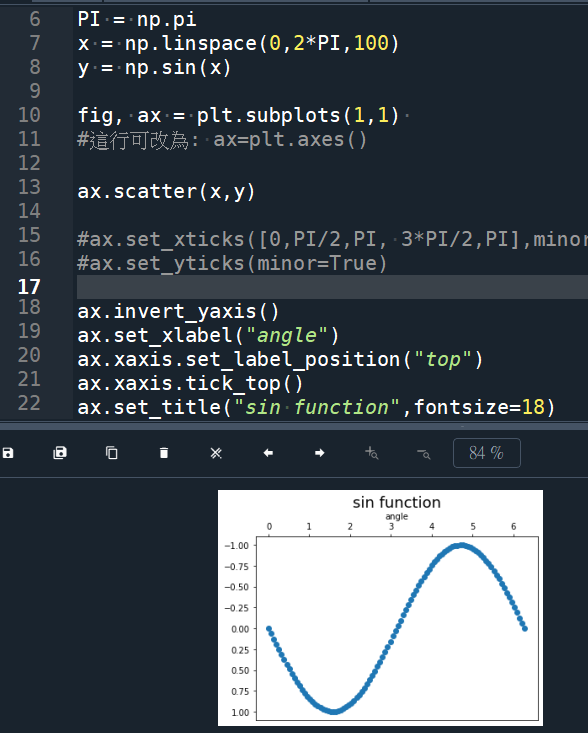
ax.scatter(x,y)
#ax.set_xticks([0,PI/2,PI, 3*PI/2,PI],minor=False)
#ax.set_yticks(minor=True)
ax.invert_yaxis()
ax.set_xlabel(“angle”)
ax.xaxis.set_label_position(“top”) #這是把label移到頂端
ax.xaxis.tick_top() #這才是把刻度線移到頂部
ax.set_title(“sin function”,fontsize=18)
如果想讓橫軸顯示PI, 2PI……
x_ticks = np.arange(0, 2*np.pi+0.01, np.pi/4)
labels = [‘$0$’, r’$\pi/4$’ , r’$\pi/2$’, r’$3\pi/4$’, r’$\pi$’, r’$5\pi/4$’, r’$3\pi/2$’, r’$7\pi/4$’, r’$2\pi$’]
plt.xticks(x_ticks, labels=labels)
# 格式化轉義 字符串首尾 r’$…$’ (matplotlib中)
# xticks(loc, labels): labels 格式化轉義方法 r’$-\frac{\pi}{2}$’ 留意分數的表示方式
# pi需要轉義才能顯示爲字符 pai. 若$-pi$ 則直接顯示-pi
# 如果沒有第二個[]參數,刻度值顯示如-3.142, -1.571…等浮點數,而不是-pi
推薦hahow線上學習python: https://igrape.net/30afN
如何用loc參數設定title/label位置?
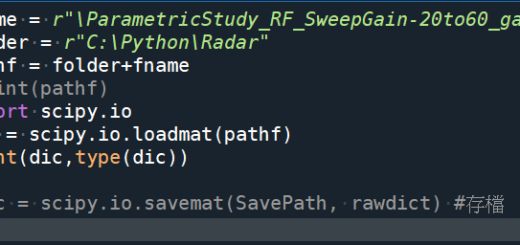
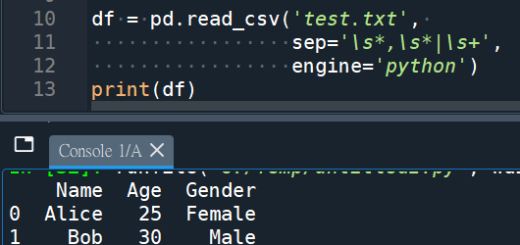
import pandas as pd
import matplotlib.pyplot as plt
import matplotlib as mpl
fpath = r”C:\22056 EPP IL\IL.xlsx”
df = pd.read_excel(fpath,header=None)
df_ILvsFreq = df.iloc[:,[7,8]].reset_index(drop=True)
df_ILvsFreq_drop = df_ILvsFreq.dropna(axis=0,how=”all”).reset_index(drop=True)
df_data = df_ILvsFreq_drop.iloc[1:,:].reset_index(drop=True)
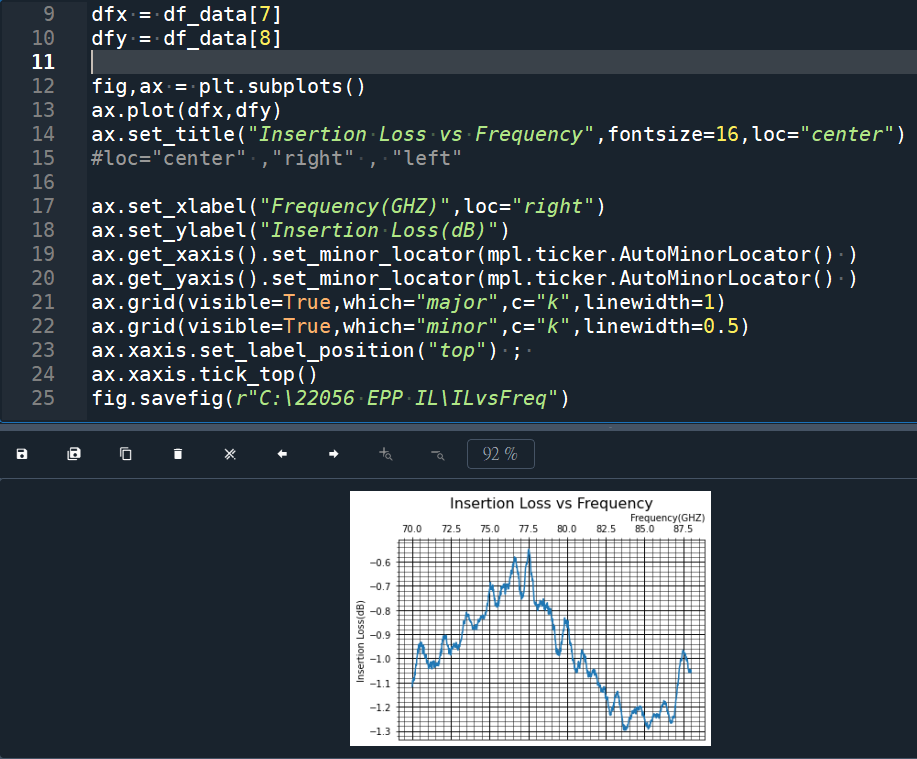
dfx = df_data[7]
dfy = df_data[8]
fig,ax = plt.subplots()
ax.plot(dfx,dfy)
ax.set_title(“Insertion Loss vs Frequency”,fontsize=16,loc=”center”)
#loc=”center” ,”right” , “left”
ax.set_xlabel(“Frequency(GHZ)”,loc=”right”)
ax.set_ylabel(“Insertion Loss(dB)”)
#ylabel的loc,可以設定”bottom” , “top”
ax.get_xaxis().set_minor_locator(mpl.ticker.AutoMinorLocator() )
ax.get_yaxis().set_minor_locator(mpl.ticker.AutoMinorLocator() )
#plt.minorticks_on()
ax.grid(visible=True,which=”major”,c=”k”,linewidth=1)
ax.grid(visible=True,which=”minor”,c=”k”,linewidth=0.5)
ax.xaxis.set_label_position(“top”) ;
ax.xaxis.tick_top()
fig.savefig(r”C:\22056 EPP IL\ILvsFreq”)
#fig.savefig(r”C:\22056 EPP IL\ILvsFreq”,bbox_inches = ‘tight’)
#存檔的圖片若有被截斷的狀況
#可以加參數bbox_inches = ‘tight’
推薦hahow線上學習python: https://igrape.net/30afN
 打造不死文檔; from docx.oxml import OxmlElement")
![Python: Regular Expression 正規表示法 正則表達式 import re ; pattn = “[\d]{4}\/[01][\d]\/[0123][\d] [\d]{6}” ; match = re .search (pattn,text) .group()](https://i2.wp.com/savingking.com.tw/wp-content/uploads/2022/09/20220901154435_19.png?quality=90&zoom=2&ssl=1&resize=350%2C233 "Python: Regular Expression 正規表示法 正則表達式 import re ; pattn = “[\d]{4}\/[01][\d]\/[0123][\d] [\d]{6}” ; match = re .search (pattn,text) .group()")


 ; socket.connect() ; socket.send()")
, math.pow(), ** 次方")
; 對於np.bool_ 做乘法等效於and ; 對於np.bool_ 做加法等效於or")
![Python: 使用 flat_list.extend( List[pandas.Series] ) 實現 pandas.DataFrame 列擴展教學](https://i2.wp.com/savingking.com.tw/wp-content/uploads/2025/04/20250421141348_0_14cedf.png?quality=90&zoom=2&ssl=1&resize=350%2C233 "Python: 使用 flat_list.extend( List[pandas.Series] ) 實現 pandas.DataFrame 列擴展教學")

近期留言